

In this Student Life Research & Data center you will find data, insights and reports based on students’ opinions about important and popular topics related to student life. Data is collected for and within the Studocu community, one of the biggest global student communities in the world. We collect data anonymously and share the voice of university, college and high school students. By providing everyone access to this portal and sharing research about topics that are important to students, we hope to better the student experience across the world.

Global Student Satisfaction
Scroll over the countries to see the average overall score for that country based on 72,000 students rating their university experience.
In late 2022 we surveyed more than 72,000 users at more than 1,300 universities across 28 countries. The findings reveal that while students are generally satisfied, certain aspects of their experience are highly desirable while others fall short. This graph below shows all the metrics in the survey.
Collectively and separately, these metrics show how students feel about their university years. The survey found that students are generally happy with their university experience. Globally, about half (48.9%) are promoters who rank their overall experience very highly—a 9 or 10 out of a possible score of 10. Only 16.0% are detractors, meaning that they scored their experience between 0 and 6 out of 10.
But there are many differences from country to country. The Netherlands, Spain, and France had the lowest shares of promoters, while Ecuador, Mexico, and Colombia had the greatest shares. On a regional level, students in North and South America are more promotional of their school as a whole compared with students in Europe, as the above map shows. A comprehensive analysis of all the survey’s metrics and the methodology can be found here.
Analyses and text by Emily Barone
Highs and Lows of Campus Life
A more granular look at the above mentioned survey metrics shows that some facets of campus life are great, while others are falling short. What’s more, there is global agreement for some metrics, and split opinions for others, depending on the region or the country.
Globally, the metrics that received the highest rates of excellent scores (a 9 or a 10 out of 10) are location (61.5%), diversity and inclusivity (54.9%), and safety (49.3%). Conversely, the dating scene, on-campus housing, and food metrics carried the largest percentage of low scores (0 to 6), at 57.6%, 50.3% and 40.4%, respectively.
Consensus and disagreement
The survey shows that certain parts of university life are universally great while others are universally poor, meaning that no significant country or regional differences existed in the assessment. The chart below illustrates which aspects of university life are most uniform around the world, and which are most polarized. For example, students across nearly every country are in agreement that the dating scene at their school is poor. And students are also in agreement that their university’s location is very good. But other metrics, including social clubs, sports culture, financial aid, and remote studying have country-level variation. With sports, for instance, the percentage of promoters ranges from the Netherlands (16.2%) to Ecuador (63.7%). A comprehensive analysis of all the survey’s metrics and the methodology can be found here.
Remote Study and the Pandemic Bump
Roughly a third of the survey respondents had graduated in the last few years, providing a unique opportunity to compare their remote learning scores to current students studying in the pandemic era. And yes, it seems things have changed.
The Pandemic Bump
The global average remote score has ticked up since the pandemic: the average score among students who are graduating in 2026 is 7.5, up from 6.9 among the cohort that graduated in 2019, the year before the pandemic.
The Digital Divide
Nearly every country’s remote score increased. Portugal, Canada, the U.K., Brazil, and Spain didn’t see much change. The countries with the highest remote learning scores (among 2022 – 2026 graduates) are the U.S., South Africa, Mexico, New Zealand, Ecuador, and Australia (all above 8.0). The lowest are Denmark, Norway,
Venezuela, Austria and Spain (all below 6.5 average).
Read more about it in this article.
Spotlight: Leaders in Remote Learning
In March 2020, universities around the world were thrust into a new reality: In order to continue classes, students and faculty had to adapt to distance learning. For some universities, the pandemic was a jolt into the unknown, while others were able to build upon foundations that had already been established.
In the U.S., for example, 84% of undergraduate students had transitioned some or all of their classes to online-only instruction in the spring of 2020, according to the National Center for Education Statistics. And though campuses have largely reopened since the height of that lockdown period, the trends are lasting—and many colleges worked through 2021 and 2022 to make their online learning platforms higher quality, more durable, and more inclusive. Our survey results show the lasting power of this virtual shift. Here’s a deeper look at a few countries with the highest remote learning scores among “pandemic students” (graduating between 2022 and 2026).
United States
With a possible 8.5 out of 10 among pandemic students, the U.S. has the highest remote learning score of any other country in the survey. The U.S. experienced a great leap: The number of undergraduate students taking at least one
virtual course was 97% higher in 2020 than in fall of 2019, and the number of those students exclusively enrolled in
virtual classes was up 186%. As in most countries, the digital shift wasn’t smooth for everyone; it created digital divides as some students lacked reliable internet or equipment once they could no longer access computer labs on campus. That prompted some colleges and university systems to launch widespread technology loan programs. Additionally, some colleges and education organizations partnered up to launch professional trainings to boost digital literacy among faculty.
South Africa
The country with the largest score gap between pandemic and pre-pandemic students was in South Africa (8.4 and 7.7, respectively). Many South African universities had not embraced virtual learning prior to the pandemic, so the newfound presence of a remote option may have shifted perceptions considerably. But several research studies and expert analyses have noted that the pivot to so-called Emergency Remote Teaching was uneven at best. In particular, already-existing disparities between richer and poorer students, and urban and rural students widened, risking further setbacks for students of lower socio-economic backgrounds.
Mexico
Mexico is not only highly rated among pandemic students (at 8.2 out of 10), but also among pre-pandemic students (who retrospectively scored it 8.0). This suggests that the country was poised to engage in remote learning ahead of the pandemic and that certain Mexican universities capitalized on a learning transformation that was already underway. For decades, the Mexican government and universities have pushed for ways to reach remote students, as evidenced by a 2016 summary of higher education initiatives. While pre-pandemic programs had mixed success — and socio-economic disparities were never holistically resolved—some institutions became exemplary case studies in their rapid transitions to digital learning. One of these schools was the Tecnológico de Monterrey, which had an advantage at the pandemic’s onset thanks in large part due to the school’s emphasis on remote learning in the years prior.
Germany' s Shifting Diversity and Inclusion Scores
One metric in our survey that hasn’t seen much global change over time is diversity and inclusion. Survey respondents who graduated in 2021 or earlier (collectively accounting for 20% of the total respondents) consistently rated diversity and inclusion at 8.1 out of 10. This is in line with 2022 alumni (also 8.1), 2023 graduates (8.2), and 2024-26 graduates (each 8.3).
But Germany is one country where students’ perceptions of diversity and inclusion at their universities may be shifting. The older cohorts consistently ranked diversity in the mid-7’s—and lower than the global average. But students in the 2022-26 cohorts have bumped the score above 8.0 (including the 2025 graduates, with a score of 8.3). This increase now puts Germany’s diversity and inclusion score in line with the global average.
While this does not prove that diversity and inclusion at Germany’s universities are actually in line with those in other nations, it can be suggested that German students now perceive these metrics at their schools much like students across the world.
The survey results contribute to ongoing research of Germany’s shifting demographics, though diversity information isn’t easy to come by. Unlike some countries including the United States and the United Kingdom, the German government does not collect race information, so it is impossible to trace demographic shifts.

Photo by Alexander Grey on Unsplash
(Other identities, such as gender identity and sexual orientation, are difficult to measure in most countries, Germany included.)
Still, due to large immigration influxes, Germany is experiencing a demographic transformation. While this shift is hard to quantify among university students in particular, there have been some publicly stated initiatives to increase inclusivity at the postsecondary and higher levels of education. Though anecdotal, these public declarations and initiatives—in conjunction with the survey findings—support the idea that university settings in Germany are becoming more diverse and more inclusive.
At the same time, however, university leaders tend to be men in their 50s, according to a recent analysis from the CHE Centre for Higher Education. Less than a quarter (23%) of higher education institutions in Germany were headed by women in 2020, the year of the study. The study did not include further demographic breakdowns, such as race or sexual orientation. Read the full article on our blog.
Course Cost & Reputation
Despite the vigorous debate about whether expensive U.S. colleges are worth their steep tuition, survey data indicate that students attending less expensive colleges do not believe they are having an inferior experience.
College cost and student satisfaction
In the U.S., there is very little difference in any metric when comparing the cost of schools. What’s most telling is that the average score for the “quality of courses” is nearly identical (8.1 for higher cost schools vs. 8.3 for lower cost schools). While not an exact proxy for cost, a comparison of U.S. community colleges versus Ivy League schools sheds some light on students’ perceived value. And like the cost analysis, most metrics are neck and neck (full data and methodology can be found here).
Academic Reputation
The analysis shows that students who are currently enrolled have higher expectations for job placement than their more recently graduated counterparts.
Changing attitudes
Young university students are more likely to believe that their school has a high academic and job placement reputation (8.0 average score out of 10 for the class of 2026) versus alumni who already graduated in recent years (7.5 average score out of 10 for those who already graduated). This speaks to the hopes, dreams, and enthusiasm that college students have — and how their perceptions change once they are graduates looking for employment. What’s notable is that students who graduated prior to 2015 rated this metric as high as the class of 2026. This could be due to the fact that those alumni have had more time to find their place in the workforce and establish a career.
Inflation & Mental Health
In January 2023 we checked in on 1,100 University students in the U.S. to understand exactly how this economic uncertainty is impacting them and their outlook for the future. What we found out painted a pretty bleak picture of the state of student mental health.
It’s no secret that the world is currently going through economically challenging times. People around the globe are feeling the pinch of record high inflation and students, who are more vulnerable to price shocks than the general population, are feeling the impact on their mental health.
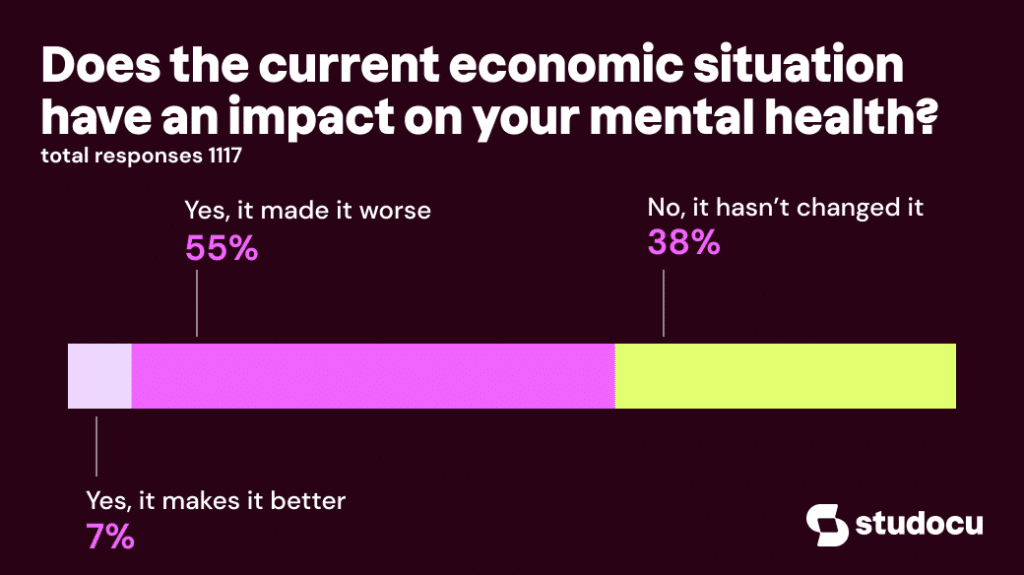
- 55% of U.S. higher education students reported their mental health got worse because of inflation.
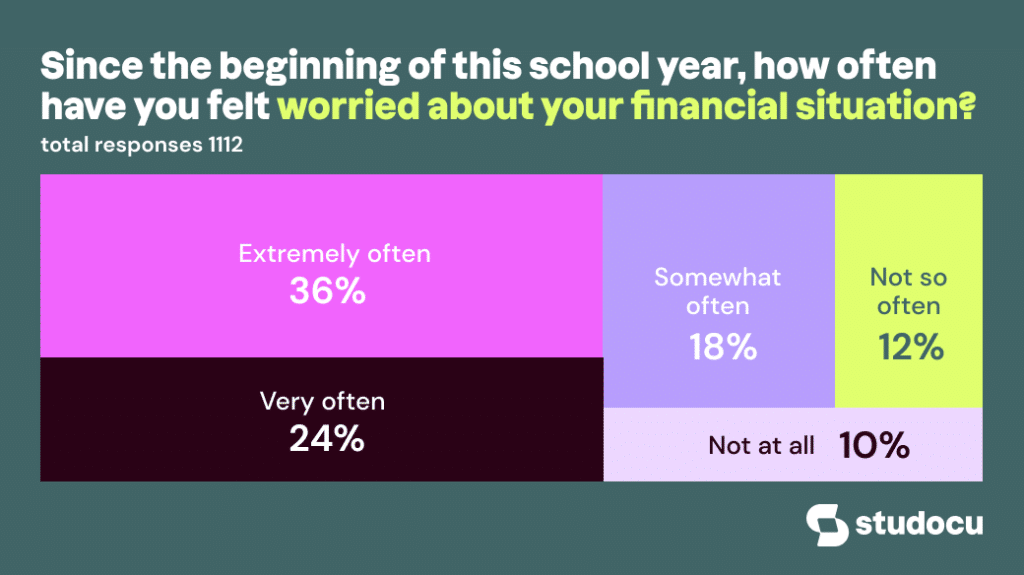
- 60% say they have felt worried about their financial situation very (24%) or extremely (36%) often since the beginning of the school year.
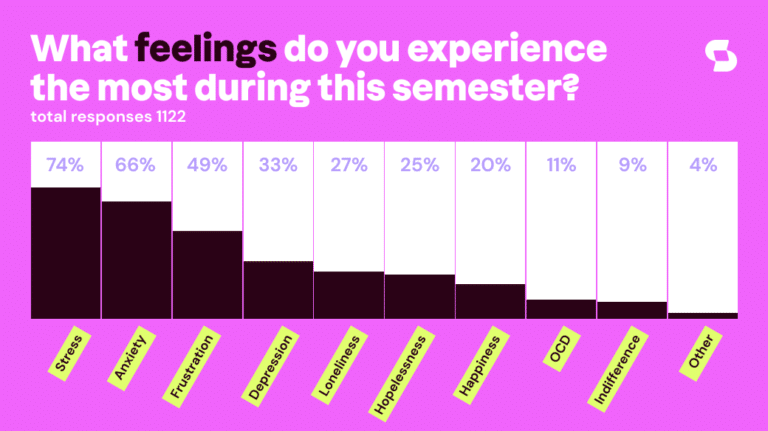
- When asked about what feelings they experience most, students indicated that they experience stress (74%), anxiety (66%), and frustration (49%) the most.
Check out all the findings of this survey in this article.
The Use of AI Tools like ChatGPT by UK Students
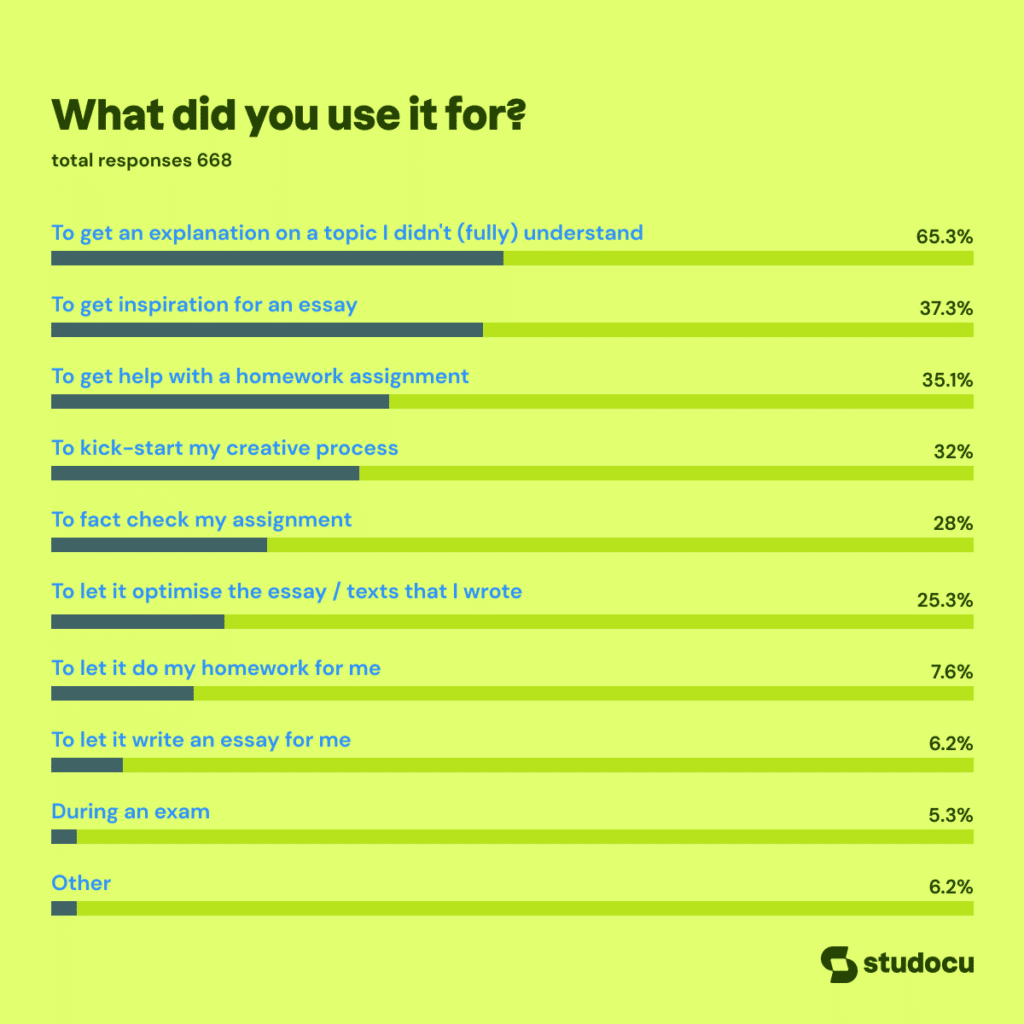
In February 2023 we surveyed more than 650 students registered on Studocu with a UK university to find out more about the use AI tools like ChatGPT. Amongst others, students responded anonymously to questions about if and how (often) they use tools like ChatGPT, what they think the impact of AI will be on student life and education, if they consider using AI tools as cheating, and if their professors noticed they used an AI tool and – if so – what consequences this had.
The results show that students aren’t using AI tools like ChatGPT as often as expected: 66% say they haven’t used a tool like this before. Of the students who did use an AI tool, 95% indicated this tool was indeed ChatGPT. Looking at the visual below, less than 20% seem to have used it to cheat. Students mainly indicate that they used it just as a check, to help understand a topic they were struggling with better, to brainstorm, etc. We also asked if they know other students who used AI to cheat. 71% indicate that they don’t. Read more about all the findings in this article.
Campus Watch: Safest & Most Dangerous Campuses - US
When it comes to choosing a college or university, ensuring a safe environment is a paramount concern for both students and their families. While no campus can claim absolute immunity from criminal activities, certain educational institutions have implemented significant measures to enhance campus safety, while others have struggled to address the issue.
To help upcoming students make the right choice when picking a university or college, we analysed data from the U.S. Department of Education to map the safest and most dangerous campuses in the United States. So, whether you’re a concerned parent, a prospective student, or an education enthusiast, join us as we navigate the nuances of campus safety in the US in this comprehensive overview including graphs, maps and tables.