
- Information
- AI Chat
WEEK 4 Assignment
Intro to Biomedical Statistics (BST 322)
National University (US)
Recommended for you

Preview text
Week 4 Assignment
- ( 1pt ) For each correlation coefficient below, calculate what proportion of variance is shared by the two correlated variables:
a. r = 0 r2 = 0. b. r = 0 r2 = 0.
c. r = 0 r2 = 0. d. r = 0 r2 = 0.
- ( 1pt ) For each coefficient of determination below, calculate the value of the correlation coefficient:
a. r 2 = 0 r = 0. b. r 2 = 0 r = 0.
c. r 2 = 0 r = 0. d. r 2 = 0 r = 0.
- ( 1pt ) Suppose a researcher regressed surgical patients’ length of stay (dependent variable) in the hospital on a scale of functional ability measured 24 hours after surgery. Given the following, solve for the value of the intercept constant and write out the full regression equation:
Mean length of stay = 6 days; mean score on scale = 33; slope = -0.
Y= a + bx 6 = a – 0(33) 6 + a – 3. 9 = a
- ( 1pt ) Using the regression equation calculated in Exercise 3, compute the predicted value of Y (length of hospital stay) for patients with the following functional ability scores:
a. X = 42 b. X = 68 Y= a + bx Y = a + bx Y + 9 – 0(42) Y = 9 – 0(68) Y = 9 – 4 Y = 9 – 6. Y = 5 Y= 3
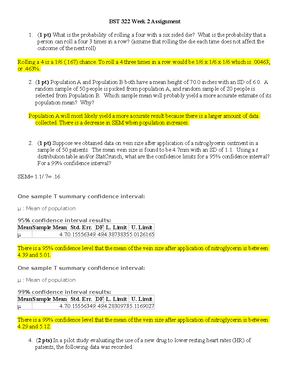
- ( 4 pts ) Reexamine the Fellows Research Group data we used in week 2’s assignment (the excel file is named “ Fellows Mental Health Data ” and is also in this week’s assignment area). Using this data set again, perform a correlation analysis using the General Practitioner Assessment of Cognition score (“ GPCOG ”) as a predictor of the Mental Health Survey Score (“ MentalHlth ”) of all subjects.
a. Plot the data with a regression line and perform a regression with the appropriate statistical test in StatCrunch. Copy and paste your graph and regression output into your Word document for full credit.
Simple linear regression results:
Dependent Variable: MentalHlth Independent Variable: GPCOG MentalHlth = 43 + 0 GPCOG Sample size: 150 R (correlation coefficient) = 0.
R-sq = 0. Estimate of error standard deviation: 10.
Parameter estimates:
Parameter Estimate Std. Err. Alternative DF T-Stat P-value
Intercept 43 2 ≠ 0 148 18 <0.
Slope 0 0 ≠ 0 148 1 0.
Analysis of variance table for regression model:
Source DF SS MS F-stat P-value
Model 1 195 195 1 0.
Error 148 17516 118.
Total 149 17711.
b. What is the correlation coefficient r and what is the coefficient of determination here? What does the coefficient of determination mean in this case? The correlation coefficient is 0. The coefficient of determination is 0 which shows that there is a 1% variability in GPCOG scored as a predictor of mental health.
b. What is the correlation coefficient r and what is the coefficient of determination here? What does the coefficient of determination mean in this case? The correlation coefficient is -0. The coefficient of determination is 0 which shows that there is about a 74% variability in XAB drug. c. Is there a statistically significant correlation between the dose and cholesterol in this sample?
The p value of 0 is smaller than 0 meaning that the results are significant. d. What hypotheses did you test?
H0 Intercept = 0 HA Intercept ≠ 0 H0 Intercept = 0 HA Intercept ≠ 0
e. Using StatCrunch, what is the predicted cholesterol level for a person taking a dose of 7 mg? Copy and paste your regression output from StatCrunch into your Word document for full credit.
Predicted values:
X value Pred. Y s.(Pred. y) 95% C. for mean 95% P. for new
7 94 27 (19, 170) (-87, 277)
The predicted cholesterol level for a dose of 7 mg is 94.
- ( 5 pts ) A study by the University of Montreal examined a new test to deepen the evaluation of mental states through the creation and validation of a practical measure, the Mental States Task (MST). The researchers examined many factors including age and the valid and reliable PANAS test. The data is in an excel file named “ Montreal_Study_on_Mental_States ” and is also in this week’s assignment area. Using this data set, perform a correlation analysis using the subject’s age (“ AGE ”) as a predictor of their PANAS score (“ PANAS ”) of all the subjects.
a. Plot the data with a regression line and perform a regression with the appropriate statistical test in StatCrunch. Copy and paste your graph and regression output into your Word document for full credit. Simple linear regression results:
Dependent Variable: PANAS Independent Variable: age PANAS = 0 + 0 age Sample size: 125 R (correlation coefficient) = 0. R-sq = 0. Estimate of error standard deviation: 0.
Parameter estimates:
Parameter Estimate Std. Err. Alternative DF T-Stat P-value
Intercept 0 0 ≠ 0 123 1 0.
Slope 0 0 ≠ 0 123 2 0.
Analysis of variance table for regression model:
Source DF SS MS F-stat P-value
Model 1 5 5 6 0.
Error 123 107 0.
Total 124 113.
Predicted values:
X value Pred. Y s.(Pred. y) 95% C. for mean 95% P. for new
23 2 0 (2, 2) (0, 4)
The predicted PANAS score for a subject that is 23 years old is 2.
- ( 1pt ) Use the multiple regression equation below for predicting graduate GPA for the two subjects below:
Y′ = -1 + 0(undergrad GPA) + 0(GREverbal) – 0(GREquant) +0(Motivation)
Subject undergrad GPA GREverbal GREquant Motivation 1 2 560 540 55 2 3 550 590 65
Subject 1: Y = -1 +(0)2 + (0)560 – (0)540 + (0) Y = -1 + 2 + 2 – 0 +. Y = 2.
Subject 2: Y = -1 +(0)3 + (0)550 – (0)590 + (0) Y = -1 + 2 + 2 – 0 + 0. Y = 3.
- ( 1pt ) Using the following information for R 2 , k , and N , calculate the value of the F statistic for testing the overall multiple regression equation and determine whether F is statistically significant at the 0. level:
a. R 2 = 0, k = 5, N = 120 F= (.13/5) / ((1-) / (120-5-1)) F= 0/ ((.87) / (114))
F = 0 / 0.
F = 3.
Our value of F is greater than critical value of 2 so our results are significant.
b. R 2 = 0, k = 3, N = 64
F= (.18/3) / ((1- .18) / (64 -3 -1)) F= 0/ ((.82) / (60)) F = 0 / 0. F = 4.
Our value of F is greater than critical value of 2 so our results are significant.
WEEK 4 Assignment
Course: Intro to Biomedical Statistics (BST 322)
University: National University (US)
This is a preview
Access to all documents
Get Unlimited Downloads
Improve your grades
