
- Information
- AI Chat
Week 4, Discussion 2
Intro to Biomedical Statistics (BST 322)
National University (US)
Recommended for you
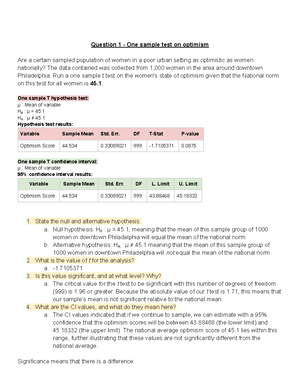


Preview text
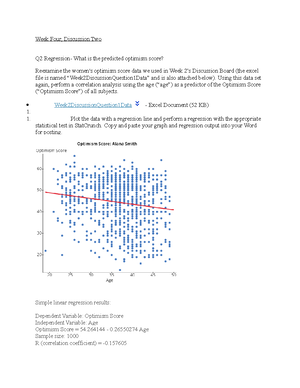
Week 4, Discussion 2: Regression - What is the predicted optimism score?
Reexamine the women's optimism score data we used in Week 2 Discussion 1. Using this data set, perform a correlation analysis using age as a predictor of the Optimism Score of all subjects. The data contained was collected from 1,000 women in the area around downtown Philadelphia.
- Plot the data with a regression line and perform a regression with the appropriate statistical test in StatCrunch. Copy and paste your graph and regression output into your Word for posting. a. See below
- What is the correlation coefficient r and what is the coefficient of determination here? What does the coefficient of determination mean in this case? a. R (correlation coefficient) = -0. b. Coefficient of determination (r 2 )= 0, which means that 2% of the variation we see in Optimism Scores can be explained by age. It can also be phrased as, “For women surveyed in the downtown area of Philadelphia, 2% of the Optimism Scores is explained by the age.”
- Is there a statistically significant correlation between age and optimism in this sample? a. Yes. We know this because the P-value is less than 0 (our P-value is <0), and because the absolute value of our R value (0) is above the critical value for 998 degrees of freedom (slightly more than 0).
- What hypotheses did you test? a. Null Hypothesis : In women living in downtown Philadelphia, there is no correlation between optimism scores and age. b. Alternative Hypothesis : In women living in downtown Philadelphia, there is a correlation between optimism scores and age. c. Because the results of our test are significant, we can safely reject the Null Hypothesis and accept the alternative hypothesis that there is a correlation between age and optimism score of women living in downtown Philadelphia.
- Using StatCrunch (be sure to copy and paste your predicted Y output from StatCrunch into your submission), what is the predicted optimism score for someone aged 45? a. The predicted Optimism score for a 45-year-old woman living in downtown Philadelphia is 42.
Correlation between Age and Optimism Score is: -0.
Simple linear regression results: Dependent Variable: Optimism Score Independent Variable: Age Optimism Score = 54 - 0 Age Sample size: 1000 R (correlation coefficient) = -0. R-sq = 0. Estimate of error standard deviation: 10.
Parameter estimates:
Analysis of variance table for regression model:
Parameter Estimate Std. Err. Alternative DF T-Stat P-value
Intercept 54 1 ≠ 0 998 27 <0.
Slope -0 0 ≠ 0 998 -5 <0.
Source DF SS MS F-stat P-value
Model 1 2716 2716 25 <0.
Error 998 106661 106.
Week 4, Discussion 2
Course: Intro to Biomedical Statistics (BST 322)
University: National University (US)
This is a preview
Access to all documents
Get Unlimited Downloads
Improve your grades
