
- Information
- AI Chat
Determining Keq For a Chemical Reaction Fall 2016
Biology 2: Concepts In Genetics (BIOL 01106)
Rowan University

Recommended for you


Preview text
Determining the Equilibrium Constant for a Chemical Reaction
1
Lab Notebook and Lab Report You must include a summary of lab procedures in your lab notebook for this lab. The summary should not be an exact copy of the lab procedures written in this document, but detailed enough for you to follow in the lab. You will not be permitted to bring this document or the procedures written in this document into the lab. You must include sketches of specified equipment to be used in the lab which you will find listed in the equipment section. You must also include any Tables to fill in your data as you perform the lab and/or Tables you need to complete the lab as part of your procedures. You should also include equations that you need for calculations which will be needed for data analysis. It is important that you have all the information for completing the calculation in your notebook.
Before coming to lab you will need to calculate and record in your laboratory notebook the concentrations of Fe3+ and SCNˉ that result from mixing stock solutions of Fe(NO 3 ) 3 and KSCN for the five solutions that you will be preparing in lab before any reaction occurs.
Your lab report should follow the format that is provided on the lab grading rubric. Be sure to include your section number and your partners name on your cover sheet. Lab report data sheets should only be filled in after the lab has been completed and all calculations are performed in your lab notebook.
OBJECTIVE
to determine the value of the equilibrium constant, Keq, for a chemical reaction to decide if Keq depends on the concentration of reactants before the reaction occurs
INTRODUCTION
Many chemical reactions do not go 100% to completion. Some amount of the reactants (and the products) remains in the reaction vessel after no further change in their concentrations can be observed. Consider reacting substances A and B that produce substances C and D:
A + B C + D
where the “ ” symbol indicates a reversible reaction, i., one that can go forward or backwards.
If A and B are mixed, at first only the forward reaction can occur, because no C or D is present. However, after C and D are produced by the forward reaction, the reverse reaction starts. As the concentration of C and D increase, the rate of this reverse reaction increases. The rate of the forward reaction slows as more A and B are used up. When the two reactions, one producing C and D, and the other consuming C and D, have equal rates no further change in concentration of any substance occurs and the reaction is said to be in equilibrium. The reactions have not stopped. Instead, the rates of the forward and the reverse reactions are identical and the system is in a dynamic equilibrium.
The ability to control the course of a chemical reaction requires an understanding of equilibrium. The concentrations of substances in a system in equilibrium at a given temperature are characterized by an equilibrium constant, K (written as an upper case letter to distinguish it from a rate constant, k). Subscripts may be written with the equilibrium constant, K, to identify the many kinds of reactions or equations they can represent. For example Keq can be used for a general equilibrium constant; Kc (concentration) specifies that in the equation the terms for all substances are expressed as concentrations; Kp (pressure) is used when the terms for gaseous compounds are expressed as pressure;
Determining the Equilibrium Constant for a Chemical Reaction
2
Ka (acids) is used for reactions in which an acid dissociates in water; and Ksp (solubility product) is used for reactions in which a solid precipitate dissolves.
PROCEDURES
SAFETY : All the solutions used in this lab contain dilute nitric acid, HNO 3 (aq) , which is corrosive. Wear lab coats, gloves and goggles. Notify your professor immediately of any spill. Turn on the Spectronic 20 when you first come into lab.
You may wish to practice pipetting before beginning this experiment.
Remember if you get liquid in the bulb: disassemble the bulb by pulling out the white plastic piece, rinse both pieces with water, and then remove all the water you can by squeezing repeatedly. Then place the parts on a paper towel to dry.
From the side bench, take back to your lab bench area in clean and dried 50 mL beakers
~40 mL Fe(NO 3 ) 3 solution ~20 mL KSCN solution ~15 mL HNO 3 solution
Accurately prepare each of the five solutions shown below by pipetting the volumes shown for that solution into a separate 6-inch test tube.
Solution 1 Solution 2 Solution 3 Solution 4 Solution 5 Volume of 2 x 10⁻³ M Fe(NO 3 ) 3 solution (mL) 5 5 5 5 5. Volume of 3 x 10⁻³ M KSCN solution (mL) 1 2 3 4 5. Volume of 0 M HNO 3 solution (mL) 4 3 2 1 0.
Mix the contents of each test tube thoroughly with a clean glass stirring rod. Rinsing the stirring rod with distilled water and drying it after mixing each solution. When all your solutions are prepared, verify that the intensity of the color changes smoothly from tube #1 to #5, with no exceptions. Observe how the color changes from one solution to the next and record your ALL observations directly into your laboratory notebook
Measuring Absorbance
Obtain 6 cuvettes (4-inch long test tubes are free of optical distortions) from the side bench. Clean them by rinsing with distilled water. Pour enough of the solution from each test tube into a cuvette to fill the cuvette about ⅔ full. Fill the sixth cuvette about ⅔ full with the 0 M HNO 3 solution. This will serve as a blank (A solution that contains none of the light-absorbing species (FeSCN2+) in this experiment.) Used the blank to set the spectrophotometer to 100% transmittance (absorbance = 0) because it does not contain any of the colored species (FeSCN2+) in solution. Set the wavelength to 447 nm, and follow the handout “Operating the Spectronic 20D or D+” operating directions carefully, step-by-step.
Measure and record the absorbance of each of your five solutions using a Spectronic 20 spectrophotometer in your laboratory notebook. After you finish measuring the absorbance of the five solutions, recheck all five measurements. Record these values in your laboratory notebook. When you are finished with the cuvettes, immediately rinse them with distilled water and return them to the side bench. The solutions used in this experiment can all be discarded in the waste bottle in the hood, or in the sink. NEVER pour any unused portions of any stock solutions back into their original bottles.
Clean your glassware and return its location. Clean your lab bench fume hood, sink areas. Check your pipet bulbs to make sure that they are dry. If they are wet - disassemble the bulb by pulling out the white plastic piece, rinse both pieces with water, and then remove all the water you can by squeezing repeatedly. Place the parts on a paper towel to dry. Check and clean the balance area before leaving the laboratory for the day.
When you finish the experimental procedure, perform the needed calculations be fore leaving class.
CALCULATIONS
Using a Spectrophotometer to Determine Concentration of Colored Species
Finding the equilibrium concentration of the red FeSCN2+ ion is a critical step in this experiment. This can be done using a spectrophotometer because FeSCN2+ is red. Spectrophotometers measure the amount of light absorbed by a colored solution – the absorbance of the solution. The absorbance is related to the concentration of the species in solution that is absorbing the incident light – the higher the concentration, the more light is absorbed. Beer’s Law describes the theoretical relationship between the three most significant factors that determine the amount of light absorbed by a solution:
A = bC
where A is the absorbance (which has no units), is the “molar extinction coefficient (which is character- istic of the absorbing species and depends on the wavelength of light used, but does not change with concentration), b is the “path length” (the distance the light travels through the solution) and C is the concentration of the colored species in the solution. In this experiment, is constant and b also is constant (the width of the cell that will contain the solution). Thus, the absorbance is proportional to the concentration. The wavelength of the light used should be at the color that is absorbed most strongly by the species being measured; for the red FeSCN2+ in this experiment that wavelength is 447 nm.
The spectrophotometer measures the percentage of light transmitted, then calculates and displays absorbance for you. The two are related: %T A = – log . 100 A “calibration curve” shows the linear relationship between the concentration of the absorbing species and its absorbance, and has already been prepared for you. (See the last paragraph for how to use it.) The calibration curve ideally is a straight line – as the concentration of the colored species increases the
- A = 4306 C – 0 ●
- ●
0 ●
● 0 ● 00.00010.00020. [FeSCN2+]
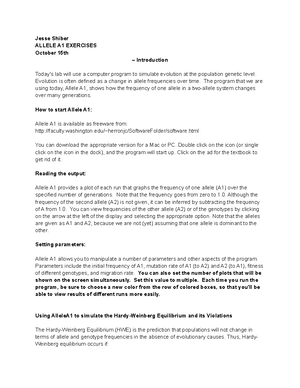
of concentration, and drawing a straight line through the linear points. This calibration curve, and the mathematical relationship between absorbance and concentration of FeSCN2+ {an equation of the form A = mC + b (like the general straight line Y = mX + b ), where the slope, m, and intercept, b, are measured from the straight line} will be given to you in lab. You could measure the absorbance of a solution of unknown concentration, and read the concentration of FeSCN2+ directly from the calibration curve. However, for greater accuracy, you will calculate the concentration (C) of FeSCN2+ using the measured absorbance (A) of the solution, and the slope and intercept of the calibration curve (which will be given to you in lab) as follows: A = m C + b
Here is the calibration curve, prepared by measuring the absorbance of five solutions having known concentrations of FeSCN2+.
Prepared [FeSCN2+]
Measured Absorbance 0 M 0. 0 M 0. 0 M 0. 0 M 0. 0 M 1.
Once you are given m (the slope of the line of the calibration curve) and b (the intercept of the calibration curve) you can rearrange this equation to calculate the concentration of any solution of the FeSCN2+ complex from its measured absorbance (A).
Calculating K eq
For each solution, use the calibration curve shown previously to calculate the equilibrium concentration of FeSCN2+ from the measured absorbance. Then use this value and the known initial concentrations of all 3 species in Reaction 1 (see Example Calculations), to calculate the equilibrium concentrations of Fe3+ and SCN ̅, and the value of Keq. You will find it helpful to use an ICE table (also called a “initial, change, and equilibrium table”) for the calculations for each of your solutions, as previously described in the Example Calculations section of this experiment. All ICE Tables need to be in your laboratory notebook.
Example
After the equilibrium concentration of FeSCN2+ is known, determining Keq is not difficult, but an example may be helpful. One of the solutions used in this experiment you will prepare by mixing 5. mL of 2–3 M Fe(NO 3 ) 3 , 1 mL of 3–3 M KSCN, and 4 mL of 0 M HNO 3. Notice that the nitrate (NO 3 ̅) and potassium (K+) ions are spectator ions and the net ionic equation is the one shown in Reaction 1 above. Notice also that the total volume of the resulting solution is 10 mL.
It is helpful to use an ICE table (a.k., “mole” table, or “Before-Change-After” table) to think about how the concentrations of the various ions are related. The ICE table is shown below for our reaction. Note that all concentrations to be entered into the table for each species are in units of moles/L.
Table 1. (prepare in your notebook before coming to lab)
Absorbance
(A)
̅ FeSCN2+
C 2 = C 1 x V 1 V 2
Fe3+ + SCN Initial Change Equilibrium All nine values of concentration to be entered are in moles/L.
The initial concentrations of Fe3+ and SCN– can be calculated with a simple formula that applies whenever a solution is being diluted by mixing with water or with another solution. Consider the Fe3+ species. The number of moles of Fe3+ in 5 mL of 2–3 M Fe(NO 3 ) 3 is the same after adding the KSCN and the water (before reaction occurs). The Fe(NO 3 ) 3 has merely been diluted. The initial number of moles added to the solution is the same before and after dilution:
moles initial = moles final
But the number of moles can be calculated from molarity (concentration, C) and volume. Therefore
C 1 x V 1 = C 2 x V 2
and the concentration after dilution is
For the example solution given above, the concentration of the Fe3+ is
C 2 = 2–3 M x 5. mL 10. mL
= 1–3 M Fe+
Enter this value into the appropriate location in the table above.
Similarly, after dilution [SCN–] = 3–3 M x 1 mL 10 m L
= 3–4 M SCN–
Of course, because we didn’t put in any FeSCN2+, its initial concentration (before reaction) is zero. Now enter both of these values also into the appropriate location in the table above.
As part of this experiment you will determine the equilibrium concentration of the red FeSCN2+ complex in each of five solutions that you will prepare in lab. You will do this by measuring in lab the absorbance of each solution and then calculating the equilibrium concentration of the FeSCN2+ complex in it using the equation for the calibration curve as shown near the bottom of page 3. In the example we are currently examining, we will assume the equilibrium concentration of FeSCN2+ is found to be 3– M.
After filling in all of the four values discussed above, Table 1 should appear like this:
2+
Because we know the initial and equilibrium concentrations of FeSCN2+, it is now easy to find the change in its concentration (the amount formed by the reaction). Fill in that concentration in the updated Table 1 above.
Now, using the change in [FeSCN2+] and the reaction stoichiometry, we can easily find the changes in [Fe3+] and [SCN ̅], since they must be in the same ratio as their stoichiometric coefficients in the reaction. Fill in these values now, and then complete the rest of the table above.
Your now completed Table 1 should be
Table 1. (After completing the lab, fill in the table in your laboratory notebook)
Finally, after you have completed the ICE table, you can use the equilibrium concentrations of all three species to calculate the value of the equilibrium constant for the mixture using Equation 1, which is reprinted below.
Keq =
[FeSCN ] [Fe3+][SCN ̄] In this experiment, you will have to make an ICE table (and perform calculations like those above) for each one of the five solutions you prepare. This will give you five separate calculated estimates of Keq.
Additional Item to be included in your “lab report” submission. Your lab report should follow the format that is provided on the lab grading
Normal title page with abstract. No Introduction/Background or Experimental Procedure sections. Notebook Procedures and follow up should o Clearly summarize how you prepared each of the five solutions. D o include your ice tables and ALL DATA Tables o Tabulate the absorbances you measured for your solutions. Including the slope and intercept that you were given for the equation for the calibration curve. o Calculations should be written in a separate section. For each of your five solutions, show the completed ICE table, the mathematical expression by which you calculated Keq with all numeric values shown, and the properly rounded value of Keq. Carry out intermediate calculations with extra digits, as always, but properly round all the values you show. Abstract Paragraph o Include statements about your results, with emphasis on whether/how you accomplished your objectives. Do your results show what you expected? If not, why not? In what way(s) were your results the same or different from what you expected? What was the value you determined for Keq? What was the Standard Deviation? Did Keq vary with the initial concentration of reactant? By what percentage did the initial concentration of SCN⁻ increase
All nine values of concentration to be entered are in moles/L.
Fe3+ + SCN ̅ FeSCN
2+ Initial 1-3 M 3-4 M 0 M Change – 3-5 M – 3-5 M + 3-5 M Equilibrium 9-4 M 2-4 M 3-5 M
from smallest to highest? How does this compare to the relative standard deviation of your Keq values (= stddev/avg ×100%)?
Data Collection Sheets (This information needs to be in your lab notebook before you come to lab. You will fill in the data directly into your notebook as you complete the lab.)
Table 1 Initial Concentration of Reactants and Absorbance at 447 nm Solution Molarity, Fe(III) Molarity , SCN-1 Absorbance Absorbance 1 2 3 4 5
Table 2 Absorbance at 447 nm and Calculated Equilibrium Concentration of FeSCN+ (from Calibration Curve on page 5) Solution Absorbance of FeSCN+2 Equilibrium Concentration of FeSCN+ 1 2 3 4 5
Table 3 Equilibrium Concentrations (from your ICE Tables) Solution Equilibrium Concentration of Fe(III)
Equilibrium Concentration of SCN-
Equilibrium Concentration of FeSCN+
Keq
1
2
3
4
5
1
rvsd October 2016 Determining the Equilibrium Constant for a Chemical Reaction Lab Report Data Summary Sheet (submit for grading)
List page(s) in lab notebook that show calculations: ______________
Table 1
Solution Equilibrium Concentration of Fe(III)
Equilibrium Concentration of SCN-
Equilibrium Concentration of FeSCN+
Keq
1
2
3
4
5
Average value of Keq,
Standard Deviation
Relative standard deviation of your Keq values ( = stddev/avg ×100%)
What is standard deviation a measure of? ___________________ (1 word)
Determining Keq For a Chemical Reaction Fall 2016
Course: Biology 2: Concepts In Genetics (BIOL 01106)
University: Rowan University


- Discover more from:


