
- Information
- AI Chat
The global competitiveness report 2018
Business management
جامعة القاهرة
Recommended for you


Related documents
Preview text
Insight Report
Klaus Schwab, World Economic Forum
The Global
Competitiveness Report
2018
The Global Competitiveness Report 2017–2018 | 11
CHAPTER 2
Key Findings of the Global
Competitiveness Index
2017–
The Global Competitiveness Report has been measuring
competitiveness for over four decades. This year also
marks the 10th anniversary of the global financial crisis
and comes at a time of increased uncertainty and rapid
transformations for the global economy. With slow and
uncertain growth recoveries, the end of the commodity
boom, shifting geopolitics, global imbalances, and
increasing inequality in some economies, understanding
the factors that determine growth continues to be a
pressing global issue.
In this chapter we present the methodology, the
rankings, and the three main findings of the Global
Competitiveness Index 2017–2018.
METHODOLOGY
We define competitiveness as the set of institutions,
policies, and factors that determine the level of
productivity of an economy, which in turn sets the level
of prosperity that the economy can achieve.
Building on Klaus Schwab’s original work of
1979, the World Economic Forum has used the Global
Competitiveness Index (GCI) developed by Xavier Sala-
i-Martín in collaboration with the Forum since 2005.
The GCI combines 114 indicators that capture concepts
that matter for productivity and long-term prosperity
(described in greater detail in Appendix A).
These indicators are grouped into 12 pillars
(Figure 1): institutions, infrastructure, macroeconomic
environment, health and primary education, higher
education and training, goods market efficiency,
labor market efficiency, financial market development,
technological readiness, market size, business
sophistication, and innovation. These pillars are in turn
organized into three subindexes: basic requirements,
efficiency enhancers, and innovation and sophistication
factors. The three subindexes are given different weights
in the calculation of the overall Index, depending on
each economy’s stage of development, as proxied by
its GDP per capita and the share of exports represented
by raw materials. Appendix A presents a description
of each pillar, a classification of economies by stage
of development, the detailed structure of the GCI, and
a description of the various steps of its computation,
including normalization and aggregation.
The GCI includes statistical data from internationally
recognized organizations, notably the International
Monetary Fund (IMF); the World Bank; and various
United Nations’ specialized agencies, including the
International Telecommunication Union, UNESCO, and
the World Health Organization. The Index also includes
indicators derived from the World Economic Forum’s
Executive Opinion Survey that reflect qualitative aspects
of competitiveness, or for which comprehensive and
comparable statistical data are not available for a
sufficiently large number of economies (see Appendix C).
The Global Competitiveness Report 2018 | 37
This chapter presents the new Global Competitiveness
Index 4 methodology. Building on the original idea of
Professor Klaus Schwab and the guidance of Professor
Xavier Sala-i-Martin of Columbia University, the GCI
4 is the culmination of a rigorous process initiated
in 2015 involving extensive review of the empirical
literature and numerous workshops and consultations.
Dozens of experts and practitioners from academia,
international organizations, NGOs, think tanks, central
banks and governments provided input and feedback
on conceptual and technical aspects to incorporate the
newest theories and indicators into the index. 1
The need to update the competitiveness index was
made clear by the combination of the ongoing effects
of the 2008’s Great Recession and the gathering pace
of the Fourth Industrial Revolution (4IR). The Great
Recession has taught us that financial crises can have
long-lasting effects on productivity. Prolonged periods
of under-investment caused by a financial meltdown
can lower the long-run growth trajectory, setting the
economic system on to a less prosperous path, even
after the financial sector eventually rebounds.
2 At the
same time, the advent of the 4IR is producing, among
other effects, an acceleration of the innovation cycle
and causing business models to become obsolete at a
faster rate. This process of constant creative destruction
generates opportunities for new entrants and reduces
the barriers to transfer technology or innovate, but also
requires managing frequent industry disruptions. To
respond to these challenges prosperous economies
need to put in place appropriate mechanisms to reduce
the risk of new financial crises and to govern the
socio-economic effects of innovation. In other words,
successful economies in the 4IR era need to:
- Be resilient, building buffers and economic
mechanisms to prevent financial crises or mass
unemployment and to respond to external shocks.
- Be agile, embracing change rather than resisting
it. Companies, public policy-makers and workers
should be able to quickly adapt how they operate
and to take advantage of the opportunities to
produce goods or provide services in new ways.
- Build an innovation ecosystem where innovation
is incentivized at all levels and all stakeholders
contribute to create the best conditions for new
ideas to emerge, to be financed and commercialized
as new products and services.
- Adopt a human-centric approach to economic
development. This means recognizing that human
capital is essential for generating prosperity and
that any policy that adversely affects human
factors’ potential will reduce economic growth in
the long run. As a consequence, policy-making will
CHAPTER 3
Benchmarking
Competitiveness
in the Fourth
Industrial Revolution:
Introducing the Global
Competitiveness
Index 4.
Chapter 3: Benchmarking Competitiveness in the Fourth Industrial Revolution
38 | The Global Competitiveness Report 2018
have to ensure that the speed of change and the
introduction of new technologies ultimately translate
into better living conditions.
Box 1 shows how to interpret the GCI 4 in light of
these concepts.
####### THE GCI 4 FRAMEWORK
The review process not only updated concepts and
statistics, but also offered an opportunity to reflect
on the scope of the GCI. The GCI 4 is focused on
the institutions, policies and other factors that drive
productivity.
3 For, as explored in Chapter 1, productivity
ultimately determines long-term economic growth, and,
although there can be trade-offs between economic
prosperity and environmental or social goals, raising
productivity is a necessary pre-condition towards greater
human development.
The Global Competitiveness Index 4 evaluates the
factors that collectively determine the level of a country’s
productivity—the most important driver of long-term
improvements in living standards.
4
The factors are organized into 12 pillars, and for
presentation purposes they are grouped into four
categories (Enabling environment, Human capital,
Markets and Innovation ecosystem), as shown in
Figure 1. While maintaining its predecessor’s objective,
the GCI 4 has re-considered what determines
productivity and its measurement: Of the 98 indicators,
34 have been retained from the previous methodology
while the other 64 indicators are new. Appendix C
presents the detailed structure of the index and the
definition of each variable. The new methodology
captures all the factors identified by the literature
and by experts as important for productivity in the era
of the 4IR.
The development of the GCI 4 has been guided by the
emergence of new fundamental changes in the functioning
of national economies with the advent of the Fourth Industrial
Revolution (4IR). These concepts span across multiple factors
captured by the GCI (see Figure 1). While organizing the index
methodology across 12 pillars provides a clear structure
for the computation of the index, and for actionable policy
indications, it is also informative to look at the 12 pillars
through the lens of the four meta-concepts described in
this chapter: resilience, agility, innovative ecosystems and
a human-centric approach. Looking at the GCI from this
perspective enables interpreting the pillars as 4IR-readiness
measures.
The concept of resilience is reflected in the Financial
system pillar (pillar 9), which includes measures to minimize
the risk of a financial meltdown and resources to adjust to
external shocks. By the same token, the Macroeconomic
stability pillar (pillar 4) captures the extent to which a country’s
public sector can provide appropriate counter-cyclical
measures and invest in projects that the private sector cannot
finance. Similarly, the Skills pillar (pillar 6) captures workers’
capacity to learn and adapt to changing circumstances.
The concept of agility is present in the Domestic market
competition and Entrepreneurial culture sub-pillars of the
index
1 because they imply greater capacity for “creative
destruction”, allowing innovative companies to emerge
against incumbents and rewarding a risk-taking attitude.
In addition, the concept is present in the Public-sector
performance sub-pillar: low levels of bureaucracy make it
easier for businesses to re-organize and re-invent themselves
when legal formalities are not taxing. Labour market flexibility
(another sub-pillar) implies agility through easier re-allocation
of talent across sectors and firms.
The innovation ecosystem encompasses all pillars.
Although business dynamism and innovation cabability are
the factors impacting innovation more directly, these need
to be complemented by high levels of human capital (health,
education and skills); optimal allocation of skills (labour
market functioning); and availability of venture capital and
ad-hoc financial products (financial system development).
A strong innovation ecosystem also presumes sound
infrastructure, ICT readiness and institutions that allow ideas
to flow and protect property rights, and a large market size
that incentivizes the generation of new ideas.
The human-centric approach to development is
embodied by the Health (pillar 5) and Skills (pillar 6) pillars,
which together account for one-sixth of the total GCI score
and take a broad approach to human capital: health is
thought of as a state of complete physical, mental and social
well-being, not merely the absence of disease or disabilities;
2
education measures the skills humans need to thrive in the
4IR. The Labour market pillar (pillar 8) includes measures
of talent reward and respect of workers’ rights, while the
Innovation capability pillar (pillar 12) includes measures that
capture human collaboration, interaction and creativity.
Notes
1 See the detailed structure in Appendix A.
2 This definition is based on the preamble to the World Health
Organization’s Constitution. See WHO, 1946.
Box 1: Navigating the GCI 4 in light of the Fourth Industrial Revolution’s (4IR) key concepts
Chapter 3: Benchmarking Competitiveness in the Fourth Industrial Revolution
40 | The Global Competitiveness Report 2018
The Macroeconomic stability pillar (pillar 4) aims to measure
the main factors impacting countries’ competitiveness via the
investment decision channel. It is based on two indicators:
Inflation (4) and Debt dynamics (4). The importance of
inflation for economic stability is well grounded in literature
and policy—inflation is an explicit target of monetary
authorities who aim at keeping it within a certain range
(the target of European Central Bank, US Federal Reserve,
Bank of Japan and Bank of England is 2%). Debt dynamics
aims to approximate the sustainability of public finance. Its
computation is relatively complex and requires adopting
goalposts that are not fully established in the literature. This
box explains its conceptual idea and its implementation in the
context of the GCI.
Over the past three decades, economists have been
debating whether high public debt matters for economic
development. There is consensus that countries cannot
sustain unlimited amounts of debt—it would clearly be
unsustainable if, for instance, interest payments were to
exceed GDP—but there is no consensus on the level of
debt at which countries’ economies begins to suffer. Some
economists believe that negative effects on long-term
growth kick in when debt reaches around 100% of GDP.
2
Others have found no causal relationship between debt and
economic growth,
3 making it hard to define a particular level
of debt at which a country’s growth would start to decline.
The lack of consensus around the level beyond which
public debt becomes too large suggests the need for taking
into account other factors. The new indicator draws on the
debt dynamic literature
4 and assesses a country’s debt
change based on four elements:
- Debt-to-GDP levels, to control for the initial level of debt
(Source: IMF’s World Economic Outlook)
- Projected change in debt, to control for how much
the debt of a country is growing (Source: IMF’s World
Economic Outlook)
- Country credit ratings, to capture qualitative and
confidence aspects (Sources: Fitch, S&P, Moody’s)
5
- A country’s development status, based on whether the
IMF categorizes it as either “Advanced” or “Emerging/
Developing”
Each country is assigned into a bracket, based on
its credit rating, debt level and development status. The
Debt dynamics indicator is computed by applying different
normalization thresholds according to the bracket to which a
country is assigned. Table 2 below summarizes the details
of the methodology. Within each bracket, the exact score
depends on the absolute change in debt level. If there is no
change or debt is decreasing, the score is the upper-bound
value. If the increase is of 20 percentage points or more, the
score is the lower-bound value. Between the extreme values,
the score is obtained by interpolation:
upper (upper lower)
debt change
20
score
For example, consider a developing country whose
rating is defined as “speculative”, the debt-to-GDP ratio
is below 50% and the debt change is 20. Based on the
methodology detailed in Table 2, this country will receive a
score of 50. Had the same developing country registered a
debt change of 10 its score would have been 55.
This methodology has the merit of incorporating all
relevant information in one indicator. However, we
acknowledge some limitations that depend on lack of data
6
and definition of thresholds. In particular, because of lack of
sufficient data availability, this indicator does not take into
account the size and liquidity of public assets. Everything
else being equal, the debt of countries with larger and more
liquid public assets, should be more sustainable.
7 Although
this information is partially reflected in credit ratings, using
“net debt” (gross debt minus public assets) would be
beneficial. Also, the debt dynamics indicator should consider
Case Lower and upper bounds used to normalize debt change
Credit rating “Default” 0 < Score < 30
Credit rating “n/a”—High debt 30 < Score < 40
Credit rating “n/a”—Low debt 40 < Score < 50
Credit rating “Speculative”—Developing country—High debt ( >60%) 30 < Score < 40
Credit rating “Speculative”—Developing country—Low debt (< 60%) 40 < Score < 50
Credit rating “Speculative”—Advanced country—High debt (>110%) 40 < Score < 50
Credit rating “Speculative”—Advanced country—Low debt ( <110%) 50 < Score < 60
Credit rating “Investment 2”—High debt ( >110%) 60 < Score < 70
Credit rating “Investment 2”—Low debt ( <110%) 70 < Score < 80
Credit rating “Investment 1”—High debt ( >110%) 80 < Score < 90
Credit rating “Investment 1”—Low debt ( <110%) 90 < Score < 100
Credit rating “Investment 1”—Very low debt ( <60%) 100
Box 2: Debt dynamics in the Macroeconomic stability pillar
1
(Continued)
Table 2: Cases for computing Debt dynamics (indicator 4) score
Pillar 5: Health
What does it capture? Health-adjusted life expectancy
(HALE)—the average number of years a newborn can
expect to live in good health.
Why does it matter? Healthier individuals have more
physical and mental capabilities, are more productive
and creative, and tend to invest more in education as life
expectancy increases. Healthier children develop into
adults with stronger cognitive abilities.
Pillar 6: Skills
What does it capture? The general level of skills of the
workforce and the quantity and quality of education.
While the concept of educational quality is constantly
evolving, important quality factors today include:
developing digital literacy, interpersonal skills, and the
ability to think critically and creatively.
Why does it matter? Education embeds
skills and competencies in the labour force. Highly-
educated populations are more productive because they
possess greater collective ability to perform tasks and
transfer knowledge quickly, and create new knowledge
and applications.
Pillar 7: Product market
What does it capture? The extent to which a country
provides an even playing field for companies to
participate in its markets. It is measured in terms of
extent of market power, openness to foreign firms and
the degree of market distortions.
6
Why does it matter? Competition supports productivity
gains by incentivizing companies to innovate; update
their products, services and organization; and supply the
best possible products at the fairest price.
Pillar 8: Labour market
What does it capture? It encompasses “flexibility”,
namely, the extent to which human resources can be re-
organized and “talent management”, namely, the extent
to which human resources are leveraged.
Why does it matter? Well-functioning labour markets
foster productivity by matching workers with the most
suitable jobs for their skillset and developing talent to
reach their full potential. By combining flexibility with
protection of workers’ basic rights, well-functioning
labour markets allow countries to be more resilient
to shocks and re-allocate production to emerging
segments; incentivize workers to take risks; attract and
retain talent; and motivate workers.
The Global Competitiveness Report 2018 | 41
Chapter 3: Benchmarking Competitiveness in the Fourth Industrial Revolution
the proportion of the debt denominated in foreign currency—
which raises the risk of an exchange rate depreciation
increasing the country’s interest’s bill, a particular concern
for many developing countries
8 –and the proportion of the
debt owed to foreigners, which is riskier because
governments cannot tax non-citizens.
9 With respect to
the definition of thresholds, the empirical evidence on the
impact of different levels of debt on its sustainability is
inconclusive. As a consequence we base our definition on
the statistical distribution of the current cross-country
distribution of debt-to-GDP ratio. Given the large confidence
intervals in determining thresholds, we have been
conservative in calibration, with most countries attaining a
score of 30 or higher. As new data and new empirical
evidence become available, the methodology will be revised
accordingly.
Despite these limitations this indicator provides a
practical way to assess a country’s fiscal situation more
accurately than just its current debt-to-GDP ratio, or a
combination of public debt level and budget balance.
Notes
1 We would like to thank Ugo Panizza, Professor, International
Economics, Pictet Chair in Finance and Development, Graduate
Institute of International and Development Studies, Geneva, for his
comments and suggestions.
2 See, among others, Reinhart and Rogoff, 2010; Kumar and Woo,
2010; Cecchetti, Mohanty and Zampolli, 2011.
3 See, for example, Panizza and Presbitero, 2012, or Égert, 2015.
4 For a formal definition refer to Escolano 2010.
5 The general credit rating for each country is computed as the
average of Fitch, Standards and Poor’s (S&P) and Moody’s credit
ratings. A country’s rating is considered “investment grade 1” for
S&P’s grades AAA to A, Moody’s grades Aaa to A1, and Fitch’s
grades AAA to A. A country’s rating is considered “investment
grade 2” for S&P’s grades A- to BBB-, Moody’s grades Baa3 to
Baa1, and Fitch’s grades A- to BBB+. A country’s rating is con-
sidered “speculative” for S&P’s grades BB+ to CCC+, Moody’s
grades Ba3 to Caa2, and Fitch’s grades BBB- to B-. A country
credit rating is considered “default” for S&P’s grade SD, Moody’s
grades Caa1 and C, and Fitch’s grades CC and RD.
6 IMF, World Economic Outlook provides information on net debt
for 84 countries, and World Bank’s Quarterly Public Sector Debt
database provides information on public debt in foreign currency
for 41 economies.
7 Notably, the government of Singapore issues bonds that are
entirely invested in other assets. Singapore‘s bonds are issued to
develop the domestic debt market rather than to finance the bud-
get deficit.
8 Eichengreen, Hausmann and Panizza, 2002.
9 Gros, Daniel, 2011.
Box 2: Debt dynamics in the Macroeconomic stability pillar
1 (cont’d.)
The Global Competitiveness Report 2018 | 51
How to Read the Economy Profiles
The Economy Profiles section presents a three-page
profile for each of the 140 economies covered in The
Global Competitiveness Report 2018.
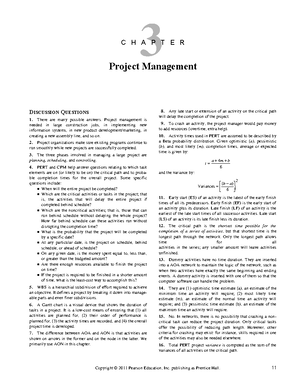
PAGE 1
Performance o verview
This section details the economy’s performance on
the main components of the Global Competitiveness
Index 4 (GCI). The chart in this section presents an
economy’s score on the overall GCI and on each of its
12 pillars. The economy’s rank (out of 140 economies) on
each category is reported at the bottom of the chart. At
the top of the chart, the three-letter code (ISO-3) of the
best performer is reported (note that there are 31 best
performers on the Macroeconomic stability pillar and
four best performers on the Health pillar). To the right
of each bar the performance of relevant benchmarks
is reported: the economy’s score in the 2017 backcast
edition (diamond); the average score of the economy’s
income g roup, b ased on t he W orld B ank’s cl assification
(triangle); and the average score of the region to which
the economy belongs (square). See the At a Glance
section o n p age x i f or r egional c lassification.
Contextual i ndicators
This section presents a selection of contextual indicators,
as well as selected indicators of social and environmental
performance, to complement the GCI. These indicators
are: Population (millions, 2017 or most recent year
available, source: International Monetary Fund, World
Economic Outlook Database, April 2018); GDP per
capita (US$, 2017 or most recent year available, source:
International Monetary Fund, World E conomic O utlook
Database, April 2018); 10-year average annual GDP
growth (% real terms, 2017 or most recent year available,
source: International Monetary Fund, World E conomic
Outlook D atabase, Ap ril 2 018); Share of GDP in World
total (%, 2017 or most recent year available, source:
International Monetary Fund, World E conomic O utlook
Database, April 2018); Unemployment rate (%, 2017 or
most recent year available, source: International Labour
Organization, ILOSTAT d atabase, via the World Bank’s
World D evelopment I ndicators d atabase); 5-year average
annual FDI inward flow (% of GDP, 20 17 or most recent
Performance Key Previous edition Upper middle income group averageEurope and North America average Overview 2018
Best
Rank /
Score
0
10
20
30
40
50
60
70
80
90
100
Overall Score Enabling Environment Human Capital Markets Innovation Ecosystem USA NZL SGP KOR (31) (4) FIN SGP USA USA CHN USA DEU
76th
68th
100th
74th
97th
45th
47th
58th
34th
105th
108th
48th
91st OverallInstitutionsInfrastructureadoptionICT economicMacro- stability
Health Skills Productmarket LabourmarketFinancialsystem Marketsize dynamismBusinessInnovationcapability
58 545752
70
87
69 57
65
51 39
64
32
Albania 76th / 140
Global Competitiveness Index 4 2018 edition Rank in 2017 edition: 80th / 135
Selected contextual indicators
Social and environmental performance
Populationmillions GDP per capitaUS$ 10-year average annual GDP growth%
GDP (PPP)% world GDP Unemployment rate% 5-year average FDI inward flow% GDP
Environmental footprintgha/capita Inclusive Development Index1-7 (best)
Global Gender Gap Index0-1 (gender parity) Income Gini0 (perfect equality) -1 (perfect inequality)
4,582.
year available, source: United Nations Conference
on Trade and Development, FDI/MNE database);
Environmental footprint network (global hectares, 2014
or most recent year available, source: Global Footprint
Network, National Footprint Accounts dataset); Inclusive
Development Index (score/rank, 2018 or most recent
year available, source: World Economic Forum, Inclusive
Development Report 2018); Global Gender Gap Index
(score/rank, 2017 or most recent year available, source:
World Economic Forum, The Global Gender Gap
Report 2017); Income Gini coefficient (0–100, 2015
or most recent year available, source: World Bank,
Development Research Group, via the World Bank’s
World Development Indicators).
Economy Profiles
52 | The Global Competitiveness Report 2018
PAGES 2–
The Global Competitiveness Index in detail
These pages detail the country’s performance on each
of the 98 indicators that compose the GCI 4. Indicators
are organized by pillar. Refer to Appendix C for the
detailed structure of the GCI, the definition of each
indicator, and computation methodology.
For each indicator, the following information is
reported:
Number, title and the units of measurement
Indicator value for the economy under review
Economy’s progress score on a 0 to 100
scale following normalization (see Appendix C
for details)
Arrow indicating the direction of the change in
score since the previous edition, or the “=” sign
if the score has remained the same
Economy’s rank (out of 140)
Name of the best performer; that is, the economy
attaining the best performance
Index Component Value Score * Rank/140 Best Performer
Pillar 1: Institutions 0-100 (best) - 53 68 New Zealand
1 crime1-7 (best) 4 51 108 Finland
1 rate/100,000 pop. 2 92 70 Multiple (9)
1 incidence1 (very high) - 7 (no incidence) 99 99 61 Multiple (24)
1 of police services1-7 (best) 5 67 46 Finland
1 capital0-100 (high) 45 45 109 Australia
Efficiency of legal framework in challenging regulations
0-100 (worst) Norway
Efficiency of legal framework in settling disputes
New Zealand
Conflict of interest regulation
Efficiency of train services Switzerland
Efficiency of air transport services
Efficiency of seaport services
Electrification rate
Electric power transmission and distribution losses
Exposure to unsafe drinking water
Reliability of water supply Switzerland
Switzerland
Inflation
Switzerland
Switzerland
Switzerland
Sweden
Ease of finding skilled employees
Albania 76th /
Index Component Value Score * Rank/140 Best Performer Pillar 1: Institutions 0-100 (best) - 53 68 New Zealand 1 crime1-7 (best) 4 51 108 Finland 1 rate/100,000 pop. 2 92 70 Multiple (9) 1 incidence1 (very high) - 7 (no incidence) 99 99 61 Multiple (24) 1 of police services1-7 (best) 5 67 46 Finland 1 capital0-100 (high) 45 45 109 Australia 1 transparency0-100 (best) 65 65= 42 Multiple (2) 1 independence1-7 (best) 2 22 126 Finland 1 of legal framework in challenging regulations1-7 (best) 2 27 114 Finland 1 of the press0-100 (worst) 29 70 62 Norway 1 of government regulation1-7 (best) 4 64 6 Singapore 1 of legal framework in settling disputes1-7 (best) 3 33 102 Singapore 1-Participation Index 0-1 (best) 0 75 58 Multiple (3) 1 orientation of government1-7 (best) 3 47 56 Singapore 1 of corruption0-100 (best) 38 38 77 New Zealand 1 rights1-7 (best) 3 46 111 Finland 1 property protection1-7 (best) 3 41 106 Finland 1 of land administration0-30 (best) 15 51= 70 Singapore 1 of auditing and reporting standards1-7 (best) 4 58 78 Finland 1 of interest regulation0-10 (best) 7 77= 16 Multiple (2) 1 governance0-10 (best) 6 67= 32 Kazakhstan Pillar 2: Infrastructure 0-100 (best) - 57 100 Singapore 2 connectivity index0-100 (best) 39 39= 115 United States 2 of roads1-7 (best) 4 54 59 Singapore 2 densitykm of roads/square km 14 36= 48 Multiple (20) 2 of train services1-7 (best) 1 5 136 Switzerland 2 connectivityindex (United States=100) 8,289 30 102 Multiple (8) 2 of air transport services1-7 (best) 3 48 96 Singapore 2 Shipping Connectivity Index0–157 (best) 7 7 100 Multiple (4) 2 of seaport services1-7 (best) 4 54 59 Singapore 2 rate% pop. 100 100= 1 Multiple (66) 2 power transmission and distribution losses% output 17 86 104 Multiple (9) 2 to unsafe drinking water% pop. 13 88 76 Multiple (23) 2 of water supply1-7 (best) 3 45 111 Switzerland Pillar 3: ICT adoption 0-100 (best) - 52 74 Korea, Rep. 3-cellular telephone subscriptions/100 pop. 119 99 70 Multiple (68) 3-broadband subscriptions/100 pop. 69 n/a 68 United Arab Emirates 3-broadband Internet subscriptions/100 pop. 10 20 73 Switzerland 3 Internet subscriptions/100 pop. 1 n/a 59 Korea, Rep. 3 users% pop. 66 66 59 Iceland Pillar 4: Macroeconomic stability 0-100 (best) - 70 = 97 Multiple (31) 4 % change 1 100= 1 Multiple (74) 4 dynamics0-100 (best) 40 40= 113 Multiple (36) Pillar 5: Health 0-100 (best) - 86 45 Multiple (4) 5 life expectancyyears 67 86 44 Multiple (4) Pillar 6: Skills 0-100 (best) - 68 47 Finland 6 years of schoolingYears 10 68= 54 Finland 6 of staff training1-7 (best) 4 49 62 Switzerland 6 of vocational training1-7 (best) 3 49 76 Switzerland 6 of graduates1-7 (best) 4 53 55 Switzerland 6 skills among population1-7 (best) 4 61 44 Sweden 6 of finding skilled employees1-7 (best) 4 50 74 United States 6 life expectancyYears 15 85 47 Multiple (9) 6 thinking in teaching1-7 (best) 4 58 19 United States 6-to-teacher ratio in primary educationRatio 18 79 66 Multiple (6)
ONLINE RESOURCES
Interactive profiles and sortable rankings with detailed
meta information, as well as downloadable datasets, are
available at gcr.weforum.
####### Performance Key Previous edition Lower middle income group average Middle East and North Africa average
####### Overview 2018
Best
Rank /
Score
0
10
20
30
40
50
60
70
80
90
100
Overall
Score
Enabling
Environment
Human
Capital Markets
Innovation
Ecosystem
USA NZL SGP KOR (31) (4) FIN SGP USA USA CHN USA DEU
94th
102nd
56th
100th
135th
99th
99th
121st
130th
99th
24th
97th
64th
Overall Institutions Infrastructure ICT adoption
Macro- economic stability
Health Skills Product market
Labour market
Financial system
Market size
Business dynamism
Innovation capability
54
48
70
41
51
69
53
48 46
52
73
54
38
Egypt 94th / 140
Global Competitiveness Index 4 2018 edition Rank in 2017 edition: 94th / 135
Selected contextual indicators
Social and environmental performance
Populationmillions
GDP per capitaUS$
10-year average annual GDP growth%
GDP (PPP)% world GDP
Unemployment rate%
5-year average FDI inward flow% GDP
Environmental footprintgha/capita
Inclusive Development Index1-7 (best)
Global Gender Gap Index0-1 (gender parity)
Income Gini0 (perfect equality) -100 (perfect inequality)
2,500.
Economy Profiles
The Global Competitiveness Report 2018 | 203
####### Egypt 94th /
Index Component Value Score * Rank/140 Best Performer
Pillar 1: Institutions 0-100 (best) - 48 102 New Zealand
1 crime1-7 (best) 5 71 43 Finland
1 rate/100,000 pop. 2 93= 67 Multiple (9)
1 incidence0 (very high) -100 (no incidence) 41 41 135 Multiple (24)
1 of police services1-7 (best) 4 63 51 Finland
1 capital0-100 (high) 44 44 113 Australia
1 transparency0-100 (best) 38 38= 110 Multiple (2)
1 independence1-7 (best) 5 69 29 Finland
1 of legal framework in challenging regulations1-7 (best) 3 45 48 Finland
1 of the press0-100 (worst) 56 43 132 Norway
1 of government regulation1-7 (best) 3 36 87 Singapore
1 of legal framework in settling disputes1-7 (best) 3 45 64 Singapore
1-Participation Index 0-1 (best) 0 53 99 Multiple (3)
1 orientation of government1-7 (best) 3 47 57 Singapore
1 of corruption0-100 (best) 32 32 99 New Zealand
1 rights1-7 (best) 4 60 51 Finland
1 property protection1-7 (best) 3 38 124 Finland
1 of land administration0-30 (best) 7 23= 122 Singapore
1 of auditing and reporting standards1-7 (best) 4 61 68 Finland
1 of interest regulation0-10 (best) 4 47= 106 Multiple (2)
1 governance0-10 (best) 6 63 45 Kazakhstan
Pillar 2: Infrastructure 0-100 (best) - 70 56 Singapore
2 connectivity index0-100 (best) 71 71= 54 United States
2 of roads1-7 (best) 4 58 45 Singapore
2 densitykm of roads/square km 5 12= 68 Multiple (20)
2 of train services1-7 (best) 3 42 58 Switzerland
2 connectivityscore 101,480 62 40 Multiple (8)
2 of air transport services1-7 (best) 5 68 43 Singapore
2 Shipping Connectivity Index0–157 (best) 54 54 26 Multiple (4)
2 of seaport services1-7 (best) 4 60 39 Singapore
2 rate% pop. 99 99 69 Multiple (66)
2 power transmission and distribution losses% output 11 92 74 Multiple (9)
2 to unsafe drinking water% pop. 10 90 71 Multiple (23)
2 of water supply1-7 (best) 4 64 69 Switzerland
Pillar 3: ICT adoption 0-100 (best) - 40 100 Korea, Rep.
3-cellular telephone subscriptions/100 pop. 105 88 92 Multiple (68)
3-broadband subscriptions/100 pop. 50 n/a 95 United Arab Emirates
3-broadband Internet subscriptions/100 pop. 5 10 88 Switzerland
3 Internet subscriptions/100 pop. n/a n/a n/a Korea, Rep.
3 users% pop. 41 41 92 Iceland
Pillar 4: Macroeconomic stability 0-100 (best) - 51 135 Multiple (31)
4 % change 16 64 135 Multiple (74)
4 dynamics0-100 (best) 37 37 127 Multiple (36)
Pillar 5: Health 0-100 (best) - 68 99 Multiple (4)
5 life expectancyyears 62 68 98 Multiple (4)
Pillar 6: Skills 0-100 (best) - 52 99 Finland
6 years of schoolingYears 7 50= 98 Finland
6 of staff training1-7 (best) 3 42 105 Switzerland
6 of vocational training1-7 (best) 3 33 136 Switzerland
6 of graduates1-7 (best) 2 31 136 Switzerland
6 skills among population1-7 (best) 4 53 70 Sweden
6 of finding skilled employees1-7 (best) 3 43 109 United States
6 life expectancyYears 13 72= 83 Multiple (9)
6 thinking in teaching1-7 (best) 2 26 123 United States
6-to-teacher ratio in primary educationRatio 23 67 86 Multiple (6)
Economy Profiles
205 | The Global Competitiveness Report 2018
The global competitiveness report 2018
Course: Business management
University: جامعة القاهرة


- Discover more from:Business managementجامعة القاهرة400 Documents


- More from:Business managementجامعة القاهرة400 Documents

