
- Information
- AI Chat
Multiple Choice Questions Chapter 3 Demand and Supply
Economic Principles- Microeconomics (BMAN10001)
University of Manchester


Related documents
- Multiple Choice Questions Chapter 11 Perfect Competition
- Multiple Choice Questions Chapter 16 Public Goods
- Multiple Choice Questions Chapter 10 Output and Costs
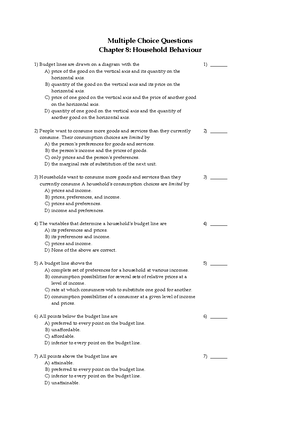
- Multiple Choice Questions Chapter 8 Household Behaviour
- Multiple Choice Questions Chapter 4 Elasticity
- Multiple Choice Questions Chapter 1 What is Economics
Preview text
Chapter 3 Demand Supply MULTIPLE CHOICE. Choose the one alternative that best completes the statement or answers the question. 1) A relative price is 1) A) the slope of the demand curve. B) the slope of the supply curve. C) the difference between one price and another. D) the ratio of one price to another. 2) If the price of a candy bar is and the price of a fast food meal is A) the money price of a fast food meal is of a candy bar. B) the relative price of a fast food meal is 5 candy bars. C) the relative price of a candy bar is 5 fast food meals. D) the money price of a candy bar is of a fast food meal. 2) 3) If the price of a hot dog is 2 and the price of a hamburger is 4, A) the relative price of a hamburger is of a hot dog. B) the relative price of a hot dog is of a hamburger. C) the money price of a hamburger is 2 hot dogs. D) the money price of a hot dog is 2 hamburgers. 3) 4) The opportunity cost of good A in terms of good B is equal to the A) price of good B minus the price of good A. B) ratio of the price of good A to the price of good B. C) price of good A minus the price of good B. D) ratio of the price of good B to the price of good A. 4) 5) The opportunity cost of a hot dog in terms of hamburgers is the A) ratio of the slope of the demand curve for hot dogs to the slope of the demand curve for hamburgers. B) ratio of the price of a hot dog to the price of a hamburger. C) price of a hot dog minus the price of a hamburger. D) ratio of the slope of the supply curve for hot dogs to the slope of the supply curve for hamburgers. 5) 6) Wants, as opposed to demands, A) are the unlimited desires of the consumer. B) depend on the price. C) are the goods the consumer has acquired. D) are the goods the consumer plans to acquire. 6) 7) Demands differ from wants in that A) wants require a plan to acquire a good but demands require no such plan. B) demands reflect a decision about which wants to satisfy and a plan to buy the good, while wants are unlimited and involve no specific plan to acquire the good. C) demands are unlimited, whereas wants are limited income. 7) D) wants imply a decision about which demands to satisfy, while demands involve no specific plan to acquire the good. 8) Scarcity guarantees that A) demands will be equal to wants. B) wants will exceed demands. C) most demands will be satisfied. D) demands will exceed wants. 8) 9) The quantity demanded is A) the amount of a good that consumers plan to purchase at a particular price. B) independent of the price of the good. C) always equal to the equilibrium quantity. D) independent of buying plans. 9) 10) The law of demand states that, other things remaining the same, the higher the price of a good, the A) larger is the quantity of the good demanded. B) smaller is the demand for the good. C) smaller is the quantity of the good demanded. D) larger is the demand for the good. 10) 11) The law of demand implies that, other things remaining the same, as A) the price of a cheeseburger rises, the quantity of cheeseburgers demanded will increase. B) the price of a cheeseburger rises, the quantity of cheeseburgers demanded will decrease. C) the demand for cheeseburgers increases, the price of a cheeseburger will fall. D) income increases, the quantity of cheeseburgers demanded will increase. 11) 12) The law of demand states that the quantity of a good demanded varies A) directly with income. B) inversely with the price of substitute goods. C) directly with population. D) inversely with its price. 12) 13) Which of the following is consistent with the law of demand? A) An increase in the price of a soda decreases the quantity of soda demanded. B) An increase in the price of a tape increases the quantity of tapes demanded. C) A decrease in the price of a gallon of milk decreases the quantity of milk demanded. D) A decrease in the price of juice does not change the quantity of juice demanded. 13) 14) The law of demand implies that if nothing else changes, there is A) a negative relationship between the price of a good and the quantity demanded. 14) A) B) C) D) Compact discs and compact disc players. Peanut butter and gasoline. Cola and lemon lime soda. Lettuce and salad dressing. 23) The demand for a good increases when the price of a substitute and also increases when the price of a complement A) rises B) falls C) falls D) rises 23) 24) A complement is a good A) of higher quality than another good. B) of lower quality than another good. C) used instead of another good. D) used in conjunction with another good. 24) 25) Suppose people buy more of good 1 when the price of good 2 falls. These goods are A) complements. B) normal. C) substitutes. D) inferior. 25) 26) As the opportunity cost of a good decreases, people buy A) less of that good but more of its complements. B) more of that good and also more of its complements. C) more of that good but less of its complements. D) less of that good and also less of its complements. 26) 27) People come to expect that the price of a gallon of gasoline will rise next week. As a result, A) the price of a gallon of gasoline falls today. B) next supply of gasoline decreases. C) supply of gasoline increases. D) demand for gasoline increases. 27) 28) The demand curve for a normal good shifts leftward if income or the expected future price A) rises B) falls C) rises D) falls 28) 29) If income increases or the price of a complement falls, the A) demand curve for a normal good shifts rightward. B) demand curve for a normal good shifts leftward. C) supply curve of a normal good shifts leftward. D) supply curve of a normal good shifts rightward. 29) 30) If income decreases or the price of a complement rises, A) there is a downward movement along the demand curve for the good. B) the demand curve for a normal good shifts leftward. C) there is an upward movement along the demand curve for the good. D) the demand curve for a normal good shifts rightward. 30) 31) A consumer might consider skates and to be A) complements. B) unrelated goods. C) substitutes. D) products with upward sloping demand curves. 31) 32) A decrease in the price of a game of bowling shifts the A) supply curve of bowling balls leftward. B) supply curve of bowling balls rightward. C) demand curve for bowling balls rightward. D) demand curve for bowling balls leftward. 32) 33) Normal goods are those for which demand decreases as A) income decreases. B) the own price rises. C) the price of a complement falls. D) the price of a substitute falls. 33) 34) A normal good is a good for which A) demand decreases when income increases. B) there are few substitutes. C) there are very few complements. D) demand increases when income increases. 34) 35) A normal good is a good for which demand A) decreases when income increases. B) decreases when population increases. C) increases when income increases. D) increases when population increases. 35) 36) Most goods A) have vertical supply curves. B) are complements to each other. C) have vertical demand curves. D) are normal goods. 36) 37) Inferior goods are those for which demand increases as A) income decreases. B) the price of a substitute falls. C) income increases. D) the price of a substitute rises. 37) 38) definition, an inferior good is a A) normal substitute good. B) good for which demand decreases when income increases. C) good for which demand decreases when its price rises. D) want that is not expressed demand. 38) 39) If a good is an inferior good, then purchases of that good will decrease when A) income increases. B) the price of a substitute rises. 39) 47) A decrease in quantity demanded caused an increase in price is represented a A) movement up and to the left along the demand curve. B) leftward shift of the demand curve. C) movement down and to the right along the demand curve. D) rightward shift of the demand curve. 47) 48) A change in which of the following alters buying plans for cars but does NOT shift the demand curve for cars? A) A 20 percent increase in the price of a car. B) A 5 percent increase in income. C) A 10 percent decrease in the price of car insurance. D) An increased preference for walking rather than driving. 48) 49) Which of the following would NOT shift the demand curve for turkey? A) A change in the price of a turkey. B) A decrease in the price of ham. C) A change in tastes for turkey. D) An increase in income. 49) 50) When we say demand increases, we mean that there is a A) movement to the right along a demand curve. B) leftward shift of the demand curve. C) rightward shift of the demand curve. D) movement to the left along a demand curve. 50) 51) In the figure above, which movement reflects an increase in demand? A) From point a to point e. B) From point a to point b. C) From point a to point c. D) From point a to point d. 51) 52) In the figure above, which movement reflects a decrease in demand? A) From point a to point e. B) From point a to point b. C) From point a to point c. D) From point a to point d. 52) 53) In the figure above, which movement reflects a decrease in quantity demanded but NOT a decrease in demand? A) From point a to point e. B) From point a to point b. C) From point a to point c. D) From point a to point d. 53) 54) In the figure above, which movement reflects how consumers would react to an increase in the price of a snack? A) From point a to point e. B) From point a to point b. C) From point a to point c. D) From point a to point d. 54) 55) In the figure above, which movement reflects an increase in the price of a substitute for fruit snacks? A) From point a to point e. B) From point a to point b. C) From point a to point c. D) From point a to point d. 55) 56) In the figure above, which movement reflects an increase in the price of a complement for fruit snacks? A) From point a to point e. B) From point a to point b. C) From point a to point c. D) From point a to point d. 56) 57) In the figure above, which movement reflects how consumers would react to an increase in the price of a fruit snack that is expected to occur in the future? A) From point a to point e. B) From point a to point b. C) From point a to point c. D) From point a to point d. 57) 58) In the figure above, which movement reflects an increase in income if fruit snacks are an inferior good? A) From point a to point e. B) From point a to point b. C) From point a to point c. D) From point a to point d. 58) 59) In the figure above, which movement reflects an increase in income if fruit snacks are a normal good? A) From point a to point e. B) From point a to point b. C) From point a to point c. D) From point a to point d. 59) 60) In the figure above, which movement reflects a decrease in population? A) From point a to point e. B) From point a to point b. C) From point a to point c. D) From point a to point d. 60) 61) Which of the following is NOT one of the factors that influences the supply of a product? A) Expected future prices. B) Number of suppliers. C) Income. D) Technology. 61) 62) The of is illustrated when A) the demand curve and supply curve are both stationary. B) the demand curve shifts along a stationary supply curve. C) the supply curve shifts along a stationary demand curve. D) the supply curve and demand curve both shift in the same direction. 62) B) holds costs of factors of production constant, whereas the supply schedule allows them to vary. C) represents one firm, whereas the supply schedule represents all firms in the market. D) holds the number of suppliers constant, whereas the supply schedule allows the number to vary. 72) Which of the following is NOT held constant while moving along a supply curve? A) Prices of factors of production. B) The number of sellers. C) Expected future prices. D) The price of the good itself. 72) 73) The supply curve is graphed with the A) quantity of a good on the vertical axis and its price on the horizontal axis. B) quantity of one good on the vertical axis and the price of another good on the horizontal axis. C) quantity of one good on the vertical axis and the quantity of another good on the horizontal axis. D) quantity of a good on the horizontal axis and its price on the vertical axis. 73) 74) In the above figure, what is the minimum supply price for the fourth gallon of ice cream? A) B) C) D) 74) 75) Which of the following shifts the supply curve for gasoline rightward? A) A decrease in the price of a factor of production used to produce gasoline, such as crude oil. B) An increase in the price of gasoline. C) A situation where the quantity demanded exceeds the quantity supplied. 75) D) An increase in the demand for sport utility vehicles. 76) Which of the following shifts the supply curve rightward? A) A decrease in the price of the factors of production used to produce the good. B) A decrease in the price of the good. C) An increase in the population. D) A positive change in preferences for the good. 76) 77) Autoworkers negotiate a wage how does this change affect the supply of cars? A) It has no effect. B) It increase the supply. C) It decreases the supply. D) There is not enough information to tell if the change increases, decreases, or has no effect on the supply of cars 77) 78) If a producer can use resources to produce either good A or good B, then A and B are A) complements in production. B) complements in consumption. C) substitutes in consumption. D) substitutes in production. 78) 79) Good A and good B are substitutes in production. The demand for good A increases so that the price of good A rises. The increase in the price of good A shifts the A) demand curve for good B rightward. B) demand curve for good B leftward. C) supply curve of good B leftward. D) supply curve of good B rightward. 79) 80) Blank tapes and prerecorded tapes are substitutes in production. An increase in the price of a blank tape will lead to A) an increase in the quantity supplied of prerecorded tapes but not in the supply of prerecorded tapes. B) a decrease in the quantity supplied of prerecorded tapes but not in the supply of prerecorded tapes. C) a decrease in the supply of prerecorded tapes. D) an increase in the supply of prerecorded tapes. 80) 81) Good A and good B are substitutes in production. The demand for good A decreases, which lowers the price of good A. The decrease in the price of good A A) increases the supply of good B. B) decreases the supply of good B. C) increases the demand for good B. D) decreases the demand for good B. 81) 82) It is expected that the price of a bushel of wheat will increase in one month. This belief will result in A) no change in current or future supply of wheat. 82) C) rotation of the initial supply curve around the initial price. D) new supply curve that is to the left of the initial supply curve. 91) A decrease in the quantity supplied is represented a A) leftward shift in the supply curve. B) rightward shift in the supply curve. C) movement down the supply curve. D) movement up the supply curve. 91) 92) Which of the following increases the quantity supplied of good X but does NOT increase the supply of good X? A) An improvement in the technology for producing X. B) An increase in the price of X. C) An increase in the price of good Y, a complement in the production of X. D) A reduction in the price of the factors of production used to produce X. 92) 93) In the figure above, an increase in the supply of oil would result in a movement from A) point a to point e. B) point a to point b. C) point a to point c. D) point a to point d. 93) 94) In the figure above, an increase in the quantity of oil supplied but NOT in the supply of oil is shown a movement from A) point a to point e. B) point a to point b. C) point a to point c. D) point a to point d. 94) 95) In the figure above, a decrease in the quantity of oil supplied but NOT in the supply of oil is shown a movement from A) point a to point e. B) point a to point b. C) point a to point c. D) point a to point d. 95) 96) In the figure above, an increase in the wages of oil workers could result in which moveme 96) nt? A) Point a to point e. C) Point a to point c. B) Point a to point b. D) Point a to point d. 97) In the figure above, the development of a new, more efficient refining technology could result in which movement? A) Point a to point e. B) Point a to point b. C) Point a to point c. D) Point a to point d. 97) 98) The figure above represents the market for candy. People become more concerned that eating candy causes them to gain weight, which they do not like. As a result, the A) demand curve will not shift, and the supply curve shifts from S1 to 98) S2. B) demand curve shifts from D1 to D2 and the supply curve shifts from S1 to S2. C) demand curve shifts from D2 to D1 and the supply curve shifts from S2 to S1. D) demand curve shifts from D2 to D1 and the supply curve will not shift. 99) The above figure represents the market for oil. Because of the development of a new deep sea drilling technology the A) demand curve will not shift, and the supply curve shifts from S1 to S2. B) demand curve shifts from D1 to D2 and the supply curve will not shift. C) demand curve will not shift, and the supply curve shifts from S2 to S1. D) demand curve shifts from D1 to D2 and the supply curve shifts 99) D) None of the above. 106) In the above figure, if the demand curve is D2, then 106) A) the equilibrium price will be P1 and the equilibrium quantity will be Q2. B) an increase in price will cause the demand curve to shift to D3. C) the equilibrium price will be P1 and the equilibrium quantity will be Q1. D) there will be a shortage equal to Q2 Q1. 107) When the price is below the equilibrium price, the quantity demanded A) exceeds the equilibrium quantity and the quantity supplied also exceeds the equilibrium quantity. B) exceeds the equilibrium quantity but the quantity supplied is less than the equilibrium quantity. C) is less than the equilibrium quantity and the quantity supplied also is less than the equilibrium quantity. D) is less than the equilibrium quantity but the quantity supplied exceeds the equilibrium quantity. 107) 108) If a market is NOT in equilibrium, then which of the following is likely to occur? A) The supply curve will shift to bring the market to equilibrium. B) The demand curve will shift to bring the market to equilibrium. C) The price will adjust to bring the market to equilibrium. D) Both A and B are correct. 108) 109) A price below the equilibrium price results in A) a shortage. B) a surplus. C) a further price fall. D) excess supply. 109) 110) Which of the following correctly describes how price adjustments elimi nate a shortage 110) ? A) As the price falls, the quantity demanded increases while the quantity supplied decreases. B) As the price rises, the quantity demanded decreases while the quantity supplied increases. C) As the price falls, the quantity demanded decreases while the quantity supplied increases. D) As the price rises, the quantity demanded increases while the quantity supplied decreases. _ A shortage causes the A) price to rise. B) supply curve to shift rightward. C) price to fall. D) demand curve to shift leftward. 112) If the quantity demanded exceeds the quantity supplied, then there is a A) surplus and the price is below the equilibrium price. B) shortage and the price is below the equilibrium price. C) shortage and the price is above the equilibrium price. D) surplus and the price is above the equilibrium price. 112) 113) If the quantity supplied exceeds the quantity demanded, then there is a A) shortage and the price is below the equilibrium price. B) surplus and the price is above the equilibrium price. C) shortage and the price is above the equilibrium price. D) surplus and the price is below the equilibrium price. 113) 114) The price of a good will fall if A) the current price is less than the equilibrium price. B) the quantity demanded exceeds the quantity supplied. C) there is a surplus at the current price. D) the price of a complement falls. 114) 115) When the price is less than the equilibrium price, A) there will be a shortage. B) the price will be forced higher. C) some consumers will be willing to pay a price higher than the prevailing price. D) All of the above answers are correct. 115) 116) If there exists a shortage in the market for snowmobiles, then the price of a snowmobile will A) neither rise nor fall. B) fall. C) at first fall then rise. D) rise. 116) 117) The existence of a shortage A) is impossible in a market economy. B) means resources are being allocated efficiently. C) pushes the price down. D) pushes the price up. 117) new 123) equilibri um quantity and equilibri um price of compact discs? A) and C) and _ B) and D) and Price (pounds Quantity Price (pounds Quantity per disc) demanded per disc) supplied 1 1 2 2 3 3 4 4 5 5 6 6 7 7 8 8 9 9 124) The above table gives the demand and supply schedules for compact discs. If the price of a compact disc is there is a and the price of a compact disc will A) fall B) rise C) fall D) rise 125) The above table gives the demand and supply schedules for compact discs. Based on the table, the equilibrium quantity and price of a compact discs is A) and B) and C) and D) and Quantity Quantity Price (euros per demanded supplied cellular phone) (thousands) (thousands) 100 50 100 80 55 80 50 60 60 20 100 40 126) Using the data in the above table, the equilibrium quantity and equilibrium price for a cellular telephone is A) 50 thousand and 100. B) 60 thousand and 50. C) 40 thousand and 20. D) 80 thousand and 80. 127) Using the data in the above table, at the price of 80 a phone, a A) shortage of 25 thousand cellular telephones occurs. 124) 125) 126) 127) B) surplus of 80 thousand cellular telephones occurs. C) shortage of 55 thousand cellular telephones occurs. D) surplus of 25 thousand cellular telephones occurs. 128) The equilibrium price in the above figure is A) B) C) D) 128) 129) The equilibrium quantity in the above figure is A) 300 units. B) 200 units. C) 400 units. D) 600 units. 129) 130) At a price of in the above figure, there is a A) shortage of 200 units. B) surplus of 200 units. C) shortage of 400 units. D) surplus of 400 units. 130) 131) At a price of in the above figure, A) the equilibrium quantity is 400 units. B) there is a shortage of 200 units. C) there is a surplus of 200 units. D) the quantity supplied is 400 units. 131) 132) If the good in the above figure is a normal good and income rises, then the new equilibrium quantity A) is 300 units. B) is less than 300 units. C) is more than 300 units. D) could be less than, equal to, or more than 300 units. 132) 133) The initial supply and demand curves for a good are illustrated in the above figure. If there are technological advances in the production of the good, then the new equilibrium price for the good A) is more than B) could be less than, equal to, or more than C) is D) is less than 133)
Multiple Choice Questions Chapter 3 Demand and Supply
Module: Economic Principles- Microeconomics (BMAN10001)
University: University of Manchester


- Discover more from:


Students also viewed
Related documents
- Multiple Choice Questions Chapter 11 Perfect Competition
- Multiple Choice Questions Chapter 16 Public Goods
- Multiple Choice Questions Chapter 10 Output and Costs
- Multiple Choice Questions Chapter 8 Household Behaviour
- Multiple Choice Questions Chapter 4 Elasticity
- Multiple Choice Questions Chapter 1 What is Economics