
- Information
- AI Chat
Confidence Intervals for Squared Effect Size Estimates in Anova What Confidence Coefficient Should be Employed
Psychological Statistics (PSYC 2101)
East Carolina University
Recommended for you


Preview text
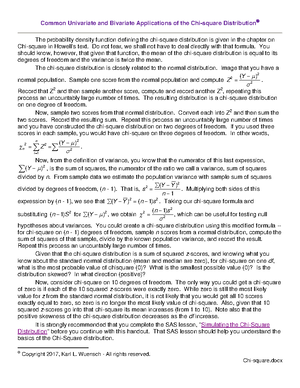
Confidence Intervals for Squared Effect Size Estimates in ANOVA: What Confidence Coefficient Should be Employed? If you want the confidence interval to be equivalent to the ANOVA F test of the effect (which employs a upper tailed, probability) you should employ a confidence coefficient of (1 For example, for the usual .05 criterion of statistical significance, use a confidence interval, not This is illustrated below. A independent samples ANOVA was conducted and produced this output: Dependent Variable: PulseIncrease Source DF Sum of Squares Mean Square F Value Pr F Model 3 355 118 3 0 Error 380 14295 37 Corrected Total 383 14651 Source Gender Image Coeff Var Root MSE pulse Mean 0 190 6 DF Anova SS Mean Square F Value Pr F 1 1 1 186 63 106 186 63 106 4 1 2 0 0 0 and a corresponding Confidence Interval will be computed for each effect. To put a confidence interval on the we need to compute an adjusted F. To adjust the F we first compute an adjusted error term. For the main effect of SSTotal SSEffect 14651 186 gender, MSE 37 . In effect we are putting 383 1 dfTotal dfEffect back into the error term all of the variance accounted for other effects in our model. MSGender 186 Now the adjusted F(1, 382) 4 . MSEGender 37 For main effects, one can also get the adjusted F simply doing a one way ANOVA with only the main effect of interest in the model: 2 proc ANOVA class model PulseIncrease Dependent Variable: PulseIncrease Source DF Sum of Squares Mean Square F Value Pr F Model 1 186 186 4 0 Error 382 14465 Corrected Total 383 14651 Coeff Var Root MSE PulseIncrease Mean 0 191 6 Source DF Anova SS Mean Square F Value Pr F Gender 1 186 186 4 0 Now use this adjusted F with the SAS or SPSS program for putting a confidence interval on R2. DATA Construct Confidence Interval for 4 df_num 1 df_den ncp_lower MAX(0,fnonct ncp_upper MAX(0,fnonct eta_squared eta2_lower ncp_lower (ncp_lower df_num df_den eta2_upper ncp_upper (ncp_upper df_num df_den proc var eta_squared eta2_lower title Interval on Interval on Obs eta_ squared eta2_ lower eta2_ upper 1 0 0 0 SASLOG NOTE: Invalid argument to function FNONCT at line 57 column 19. NOTE: Mathematical operations could not be performed at the following places. The results of the 4 ncp_upper MAX(0,fnonct Interval on Obs eta_ squared eta2_ lower eta2_ upper 1 0 0 Notice that the CI does exclude zero, but barely. A CI would include zero. Reference Steiger, J. H. (2004). Beyond the F test: Effect size confidence intervals and tests of close fit in the analysis of variance and contrast analysis. Psychological Methods, 9, Karl L. Wuensch, Dept. of Psychology, East Carolina Univ., Greenville, NC USA September, 2009
Confidence Intervals for Squared Effect Size Estimates in Anova What Confidence Coefficient Should be Employed
Course: Psychological Statistics (PSYC 2101)
University: East Carolina University


