
- Information
- AI Chat
Tan Melissa Frappy 7 - AP stats chapter 7
Statistics for Social Sciences (STAT221)
University of Washington
Students also viewed
- Week One - Chapter one summary - The Real World: an Introduction to Sociology
- INFO 102 Week 4 Notes
- Phys 322 course outline
- Chem 162 lab 3 - 162 Lab 3 Part II "TAKE-HOME" Report: Intermolecular Forces (take-home portion
- P302 Makeup Quiz 6
- Final Exam 2021 FIN 460 - finance 460 practice exam. Great practice for future exam
Preview text
Chapter 7 FRAPPY!
Directions: Show all your work. Indicate clearly the methods you use, because you will be scored on the correctness of your methods as well as on the accuracy and completeness of your results and explanations.
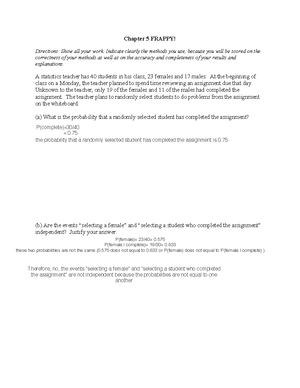
The principal of a large high school is concerned about the number of absences for students at his school. To investigate, he prints a list showing the number of absences during the last month for each of the 2500 students at the school. For this population of students, the distribution of absences last month is
skewed to the right with a mean of = 1 and a standard deviation of 1.
Suppose that a random sample of 50 students is selected from the list printed by the principal and the sample mean number of absences is calculated.
(a) What is the shape of the sampling distribution of the sample mean? Explain.
(b) What are the mean and standard deviation of the sampling distribution of the sample mean?
(c) What is the probability that the mean number of absences in a random sample of 50 students is less than 1?
(d) Because the population distribution is skewed, the principal is considering using the median number of absences last month instead of the mean number of absences to summarize the distribution. Describe how the principal could use a simulation to estimate the standard deviation of the sampling distribution of the sample median for random samples of size 50.
Tan Melissa Frappy 7 - AP stats chapter 7
Course: Statistics for Social Sciences (STAT221)
University: University of Washington


Recommended for you
Students also viewed
- Week One - Chapter one summary - The Real World: an Introduction to Sociology
- INFO 102 Week 4 Notes
- Phys 322 course outline
- Chem 162 lab 3 - 162 Lab 3 Part II "TAKE-HOME" Report: Intermolecular Forces (take-home portion
- P302 Makeup Quiz 6
- Final Exam 2021 FIN 460 - finance 460 practice exam. Great practice for future exam