- Information
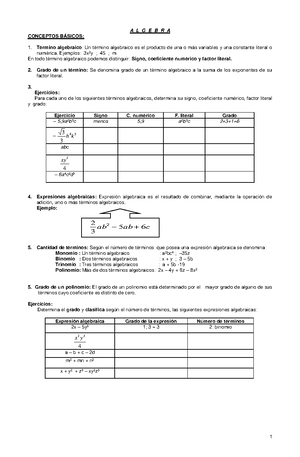
- AI Chat
Modeling, Simulation, and Analysis of Baccarat - A Critical View of Card Counting, Odds, and Bets
Math (math)
Univerza v Ljubljani
Preview text
Modeling, Simulation, and Analysis of Baccarat:
A Critical View of Card Counting, Odds, and Bets
By
Charles Madewell
Brian M.
Ann R.
January 14, 2004
i
Abstract:
Since Baccarat is one of the easiest casino table card games to play and has one of the lowest house advantages, it provides just enough deception to lure the bettor into a false sense of winning and often teaches the bettor that the effects of long term playing will most assuredly end up in a net loss. This paper investigates the use of card counting to attempt to overcome the house advantage. An introduction to Baccarat, its rules, current card counting strategies, and betting strategies are presented as well as research into probabilities, expected values of betting, and the mathematics of the game. A C++ computer model of Baccarat is developed to verify known results and to further add to the body of knowledge by providing additional results substantiating the fallacy of card counting methods, the low odds of the player winning, and the futility of playing Baccarat on a long-term basis.
1 Baccarat Introduction
1 Introduction
Baccarat (pronounced bah-caw-rah) dates to the middle ages in Italy and was originally played with a Tarot deck. The word baccarat is derived from the Italian word baccara, meaning zero, and refers to the value given to all the face cards and tens. Migrating to France, it became the game of choice for the aristocracy. It has since mutated into the multiple different versions of the game that are played today. The French “chemin de fer” game is similar to what is played in casinos today. What is known as American baccarat actually originated in England and spread to South America. The version of the game that is played today came from the Capri Casino in Havana, Cuba. 1 Mini-baccarat is another version played in casinos today.
Since baccarat's introduction in Nevada casinos, the game has assumed an aura of glamour. In most casinos, baccarat is played in a roped-off area. The intention was to attract the high roller, or the more sophisticated moneyed player. With the tuxedo-clad dealers, there is an air of elegance to the game. However, for all the enchantment, baccarat is primarily a simple game. There are no decisions or options; no degree of skill is required for bettor.
1 Rules of Play
Baccarat is a card game that is dealt from a shoe that holds 6 or 8 decks of cards. Before the hands are dealt, bets may be placed on the banker hand, on the player hand, or on a tie. Winning bets on banker or player are paid 1:1, but a commission of 5% is charged on bank bets making the net odds on such bets 0 to 1. Some casinos may charge a lower commission (e., at this writing, Binion's Horseshoe in Las Vegas charges 4%.). At some casinos, tie bets are paid 8:1, while at others tie bets are paid 9:1. If there is a tie, bets on the banker or player are returned. Once a bet has been placed, there are no opportunities for further decisions -- both the banker hand and the player hand are dealt according to fixed rules, resulting in final hands of either two or three cards for each.
1 absolutebaccarat/www/b9.htm
The value of a hand is determined by adding the values of its individual cards. Tens and face cards are counted as zero, while all other cards are counted by the number of "pips" on the card face. Only the last digit of the total is used, so all baccarat hands have values in the range 0 to 9 inclusive. The hand with the higher value wins; if the hands
have the same value, the result is a tie. The suit of the card has no affect.
A game is played by dealing two cards for the player hand and two cards for the bank hand. An initial hand with a value of 8 or 9 is called a "natural." If either hand is a natural, its holder must expose it and the game ends. Otherwise play continues, first with the player hand and then with the banker hand, according to the following rules.
Rules for the player hand: If the player's first two cards total 6 or more, then the player must stand without drawing a card. If the player's first two cards total 5 or less, the player must draw one additional card.
who bet sporadically and may bar them for being card counters. Fourth, the frequency at which these favorable bets can be made is very low.
Currently, the most popular card counting strategy is based on the work of Walden. He determined the relative change of winning probabilities for the player and bank hands when a single card of each value was removed from an 8-deck shoe. The changes in winning probabilities give rise to relative point values for each card as it is removed from the shoe. Table 2 from Walden’s thesis is summarized below.
Removed Card Value
% Change in Player Bet Wins after Card Removal
% Change in Bank Bet Wins after Card Removal
Relative Point Value 0 -0 0 2 1 -0 0 4 2 -0 0 5 3 -0 0 7 4 -0 0 11* 5 +0 -0 - 6 0 -0 - 7 0 -0 - 8 0 -0 - 9 0 -0 -
- Arbitrarily reduced from 12 to 11 so points in pack total zero
Given these relative point values, an approximate point count has been determined as:
Ace Ten Nine Eight Seven Six Five Four Three Two +1 0 0 -1 -2 -2 -1 +2 +2 +
To use these values in a card counting system, start with an initial value of zero and keep a running count of the card count values as they are played. Divide the running count by the number of remaining decks to get the true count. Whenever the true count gets to –1 or lower, bet on the player. When it gets to +1 or higher, bet on the banker.
1 Betting Strategies
The Martingale betting strategy is the easiest to understand and seems quite logical, but it can be quite dangerous to use in practice. This system basically says to make a bet for double the previous bet amount each time a bet is lost. The theory is that when the next time that a hand is won, the bettor will ultimately end up ahead. For example, bet $5 and lose, next time bet $10, and if that bet loses, bet $20 the next time. Say the $20 hand is a winner, the bettor will be up $20 win - $15 loss = $5. The problem with this strategy is the bettor must risk losing a significant amount of money and he may run into a table maximum policy that will prevent him from doubling his last bet. The other problem is that he may not have enough resources to continue doubling after each loss even if the table doesn’t have a maximum policy.
Some bettors believe they can take advantage of streaks in shoes. Upon entry into a baccarat game, every player is offered a scorecard. Use it to keep track of which hand wins. If both the player and banker bets are participating in short term streaks, play the streaks with a paroli of three. This means the bettor should parlay his bet twice, going for three hands in a row. If the shoe is choppy, bet whatever side lost the last hand.
The 1-3-2-6 Betting System 2 is also popular. While it may seem otherwise to some newcomers, the odds actually favor the casino and no betting system can change that fact. But many say this system works well for short term betters. What makes the 1-3- 2-6 system attractive to bettors is they risk only two betting units for a chance to win ten. In other words, the bettor can make a nice profit with a minimal investment.
The first bet is one unit - if it is a winner:
- Add another unit, making the second bet a total of three units.
- If the second bet is won, there are 6 units on the table. Remove four units, making the third bet two units. 2 baccarat-hangout/b7.htm
1.5 Effects of Shoe Size on House Edge
The number of decks in a shoe influences the odds of the bets of Baccarat. In the charts below, the 8 deck, 6 deck, and single deck statistics are given for the probabilities of play and the House edge. These charts were first found on “The Wizard of Odds” website and have been recreated here. The pay-back odds for the tie bet are 9:1. All tables have a 5% commission for the bank bet (see next section).
An example calculation for the bank bet expected value for 8 decks given the published win probability values of 44% for player bets and 45% for bank bets for an 8- deck shoe:
Bank Bet Expected Value = Pp (-1 unit) + Pb (1 unit - Vig) = .4462(-1) + .458597(0) Bank Bet Expected Value = -1%
An example calculation for the player bet expected value for 8 decks given the published win probability values of 44% for player bets and 45% for bank bets for an 8- deck shoe:
Player Bet Expected Value = Pp (1 unit) + Pb (-1 unit) = .4462(1) + .458597(-1) Player Bet Expected Value = -1%
An example calculation for the tie bet expected value for 8 decks given the published win probability value of 9% for ties bets in an 8-deck shoe is given as:
Tie Bet Exp Value = Pp (-1) + Pb (-1) + Pt (8)] = .4462(-1) + .458597 (-1) + .095156(8) Tie Bet Exp Value = -14%
8-Deck Summary Bet on: Probability (%) House Edge (%) Bank 45 1. Player 44 1. Tie 9 14.
From the charts above, it can be seen that the general trend is that the fewer the number of decks played, the lower the house edge. For instance, at the 8-Deck and Single-Deck games, the house edge for bank bets decreases from 1 to 1%. On the other hand, the house edge for bets on the player rises from 1 to 1%. The most apparent change occurs on house edge for tie bets. The house edge for tie bets increases from 14 to 15%. This shows that when the playing one deck, the bettor should usually bet on the bank (unless card counting indicates otherwise).
1.5 Effects of Commission on House Edge
In most casinos, a commission is charged for all money won on the Bank bets. The commission is most commonly referred to as “Vigorish” or “Vig” for short. Commissions vary from 1 to 6% but are most commonly 5%. The chart below, recreated from the website icancasino, summarizes the house advantage on banker bets for various commissions. For these charts, ties are included and the pay-back odds are 8:1.
6-Deck Summary 5% Vig Bet on: Probability (%) House Edge (%) Bank 45 1. Player 44 1. Tie 9 14.
Single-Deck Summary 5% Vig Bet on: Probability (%) House Edge (%) Bank 45 1. Player 44 1. Tie 9 15.
1.5 Effects of Tie Bets Returned on House Edge
Previous analysis showed the probabilities including tie bets. Since tie bets are returned to the bettor (he neither wins nor loses his bet amount), it is necessary to look at these probabilities. The chart below shows the probabilities and house edge values for both the ties included and no ties included cases (for an 8-deck shoe and a 5% commission).
The calculations for the probabilities for tie-bets returned case are shown below:
With ties: 45 + 44 = 90. 100 / 90 = 1. 45 * 1 = 50 (Probability of bank win when tie bets are returned) 44 * 1 = 49 (Probability of player win when tie bets are returned)
House Edge on Player Bets = Pp (1) + Pb (-1) = .493149 -. House Edge on Player Bets = -1%
House Edge on Bank Bets = Pp(-1) + Pb(1-vig) = .506851(1-) -. House Edge on Bank Bets = -1%
Since the house edge in the no ties bets returned increases, it is to the bettor's advantage to never play Baccarat where tie bet moneys are not returned to the bettor. Interestingly enough, if ties are not returned, Baccarat can be thought as flipping a player/bank coin that is slightly biased towards the bank side and if that bias helps the bettor win, the casino gets a ‘cut’.
Ties Included Case Tie Bets Returned Bet on: Probability (%) House Edge (%) Bet on: Probability (%) House Edge (%) Bank 45 1 Bank 50 1. Player 44 1 Player 49 1. Tie 9 14.
1.5 Card Counting Statistics Summary
The chart below (reference thewizardofodds) shows the effects of knowing the first 90, 95, or 98% of the cards played and gives the probability of obtaining a favorable bettor edge for the different bets.
The next chart translates this into the expected profit the bettor would yield if he could perfectly count the cards down to the shown percentage and make bets of $1000 every time a positive expectation occurred.
Expected Profit Penetration Bank Bet Player Bet Tie Bet 90 $0 $0 $ 95 $0 $0 $0. 98 $2 $1 $11.
As the chart above shows, the expected profit is very low and it seems that it is not worth the effort of trying to obtain a count down to this level. For example, assuming it takes one minute to play one hand and further assuming that each hand takes 10 cards on the average, a bettor can expect the cards to reach 98% penetration into the original 8 decks approximately once every 40 minutes. Noting the positive expectation percentage is approximately 1% over all the bets at 98% percent penetration, it is easy to see that the expected payoffs for each $1000 bet is just not worth it.
Percentage of Time the Bettor has an Edge Over the House Penetration Bank Bet Player Bet Tie Bet 90 0 0 0. 95 0 0 0. 98 0 0 0.
State Transition Matrix for Gambler’s Ruin – Player Bet
The transition probability matrix for the real case shown above was taken to its steady state probabilities in approximately 800 hands. The steady state probabilities for all cells 1 through 19 were found to be zero (0). This is proof of the fact that the 0 and 20 states are absorbing states and that all other states are transient. In other words, a bettor will either end up with nothing or everything. The probability for states (0,0) and (20,20) are
- A formula used to verify the accuracy of the results calculated by Matlab for the steady state probabilities matrix, is shown below.
1-fy0 = sum from x=0 to y-1 of x divided by sum from m=0 to m- 1 m where y = any current state and m = the final state, and = (1 – P) / P where P is the probability for either the player or bank bet. Therefore, fym = 1 - fy
These equations can be used to find any value of the first and last columns of the steady state probability matrix. The steady state probabilities are shown in the “Probability to T” and “Probability to 0” in the charts to follow.
The next chart below gives the long run play earned values for each of the states. The earned value/profit column was calculated by multiplying “Probability to T” times “Potential Winnings” and subtracting “Probability to 0” times “Potential Loss”. As one can see from the table, the expected value is always negative. This shows that regardless of the beginning state, extended long term play will usually end up with a complete loss of the bettor’s initial amount of betting money.
Player Bet Advantage - Long Run Play Probability to T Probability to 0 Player -
- State
-
- 1 0 0 0
- 2 0 0 0 0
- 3 0 0 0 0 0
- 4 0 0 0 0 0 0
- 5 0 0 0 0 0 0 0
- 6 0 0 0 0 0 0 0 0
- 7 0 0 0 0 0 0 0 0 0
- 8 0 0 0 0 0 0 0 0 0 0
- 9 0 0 0 0 0 0 0 0 0 0 0
- 10 0 0 0 0 0 0 0 0 0 0 0 0
- 11 0 0 0 0 0 0 0 0 0 0 0 0 0
- 12 0 0 0 0 0 0 0 0 0 0 0 0 0 0
- 13 0 0 0 0 0 0 0 0 0 0 0 0 0 0 0
- 14 0 0 0 0 0 0 0 0 0 0 0 0 0 0 0 0
- 15 0 0 0 0 0 0 0 0 0 0 0 0 0 0 0 0 0
- 16 0 0 0 0 0 0 0 0 0 0 0 0 0 0 0 0 0 0
- 17 0 0 0 0 0 0 0 0 0 0 0 0 0 0 0 0 0 0 0
- 18 0 0 0 0 0 0 0 0 0 0 0 0 0 0 0 0 0 0 0 0.
- 19 0 0 0 0 0 0 0 0 0 0 0 0 0 0 0 0 0 0 0
- 0 0 1 -1. From (Win All) (Lose All) A
- 1 0 0 -0.
- 2 0 0 -0.
- 3 0 0 -0.
- 4 0 0 -0.
- 5 0 0 -0.
- 6 0 0 -0.
- 7 0 0 -0.
- 8 0 0 -0.
- 9 0 0 -0.
- 10 0 0 -0.
- 11 0 0 -0.
- 12 0 0 0.
- 13 0 0 0.
- 14 0 0 0.
- 15 0 0 0.
- 16 0 0 0.
- 17 0 0 0.
- 18 0 0 0.
- 19 0 0 0.
- 20 1 0 1.
The next two charts show the same two charts shown previously, but for the imaginary case were the card player now has somehow improved his odds to 50% win expectancy for player bet. This time, from state 10 the bettor is expected to reach state 20 at least half the time, and the expected value for long term playing is 0. Even with the better expected value, the player can only break even in the long run. This illustrates the potency of even a tiny casino percentage advantage of winning over the long run.
Imaginary Case - Player Bet Expected Value – Long Run Play Probability to T Potential Winnings
Probability to 0
Potential Loss
Expected Value
From (Win All) (Lose All) 0 0 1000000 1 0 0 1 0 950000 0 50000 0 2 0 900000 0 100000 0 3 0 850000 0 150000 0 4 0 800000 0 200000 0 5 0 750000 0 250000 0 6 0 700000 0 300000 0 7 0 650000 0 350000 0 8 0 600000 0 400000 0 9 0 550000 0 450000 0 10 0 500000 0 500000 0 11 0 450000 0 550000 0 12 0 400000 0 600000 0 13 0 350000 0 650000 0 14 0 300000 0 700000 0 15 0 250000 0 750000 0 16 0 200000 0 800000 0 17 0 150000 0 850000 0 18 0 100000 0 900000 0 19 0 50000 0 950000 0 20 1 0 0 100000 0
Modeling, Simulation, and Analysis of Baccarat - A Critical View of Card Counting, Odds, and Bets
Course: Math (math)
University: Univerza v Ljubljani